


Highlights
- GQG’s FUM rose to USD 161.7 billion as of 31 March 2025, with USD 4.6 billion in net inflows during the March quarter.
- In FY24, the company recorded net revenue of USD 760.4 million, up 46.91% YoY
- Net inflows reached USD 20.2 billion in FY24, nearly double FY23’s USD 10.2 billion
GQG Partners Inc. (ASX:GQG) is a U.S.-headquartered boutique asset management firm that specialises in active equity portfolios. In recent updates, the company revealed that its Funds Under Management (FUM) had risen to USD 161.7 billion as of 31 March 2025, up from USD 160.5 billion at the end of February. This increase was largely driven by net inflows of USD 4.6 billion during the March quarter.
In the financial year ended 31 December 2024 (FY24), net revenue surged 46.91% YoY to USD 760.4 million while net income attributable to shareholders climbed 52.78%YoY to USD 431.6 million. Total assets rose by 19.11% YoY to USD 463.9 million. The company’s revenue growth was significantly supported by annual net inflows of USD 20.2 billion, nearly double the USD 10.2 billion reported in FY23. Additionally, its operating income jumped by 50.4% to USD 577.9 million from USD 384.4 million the previous year.
GQG attributes much of its revenue stability to a competitive fee structure, with a weighted average management fee of 49.6 basis points—lower than many peers. Notably, over 96% of its revenue is derived from asset-based fees, providing a reliable and predictable income stream.
Outlook
Looking ahead, GQG's management remains optimistic about the FY25 outlook. Despite external challenges such as market volatility and geopolitical uncertainties, the company emphasises its focus on strong fundamentals and long-term investment performance. It plans to continue adapting its strategies to capture future growth opportunities, supported by a steady flow of investor capital and disciplined operations.
Adding to shareholder value, the company has also decided to raise its dividend payout ratio to between 50% and 95% of distributable earnings.
GQG’s Annual General Meeting is scheduled to be held on 22 May 2025.
Share performance of GQG
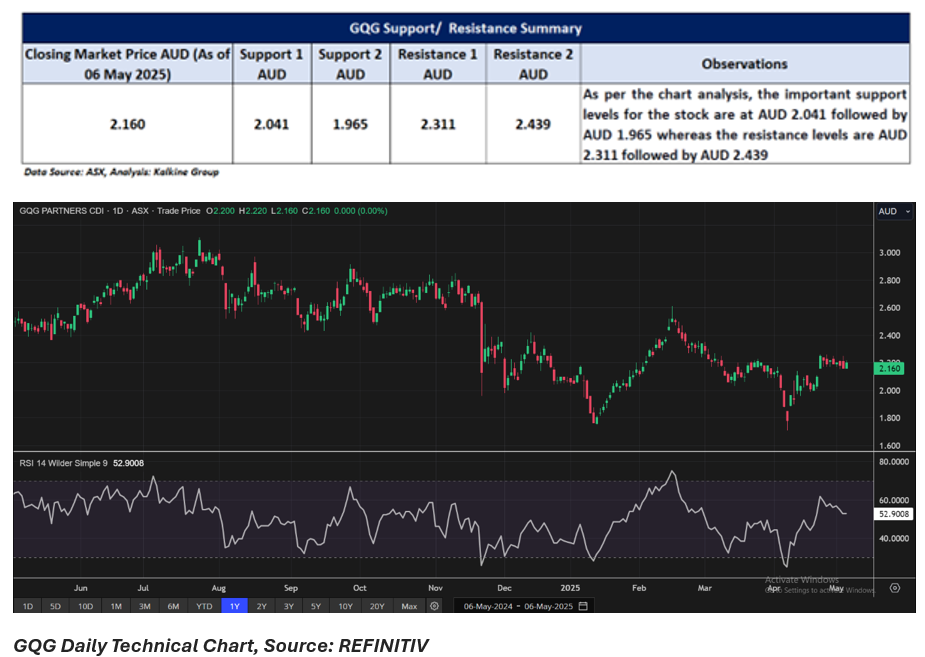
GQG shares closed unchanged at AUD 2.160 per share on 6 May 2025. Over the past one month, the stock has surged by 14.59%, marking a net gain of AUD 0.275. However, on a broader time scale, GQG has experienced downward pressure, with its share price declining by 13.60% over the past year.
The 52-week high for GQG was AUD 3.110, achieved on 24 July 2024, while the 52-week low stood at AUD 1.710, recorded recently on 7 April 2025. The current price is approximately 30.55% below its 52-week high.
Support and Resistance Summary
Note 1: Past performance is neither an Indicator nor a guarantee of future performance.
Note 2: The reference date for all price data, and currency, is 06 May 2025. The reference data in this report has been partly sourced from EODHD/Others.
Technical Indicators Defined:
Support: A level at which the stock prices tend to find support if they are falling, and a downtrend may take a pause backed by demand or buying interest. Support 1 refers to the nearby support level for the stock and if the price breaches the level, then Support 2 may act as the crucial support level for the stock.
Resistance: A level at which the stock prices tend to find resistance when they are rising, and an uptrend may take a pause due to profit booking or selling interest. Resistance 1 refers to the nearby resistance level for the stock and if the price surpasses the level, then Resistance 2 may act as the crucial resistance level for the stock.
Disclaimer
This article has been prepared by Kalkine Media, echoed on the website kalkinemedia.com/au and associated pages, based on the information obtained and collated from the subscription reports prepared by Kalkine Pty. Ltd. [ABN 34 154 808 312; AFSL no. 425376] on Kalkine.com.au (and associated pages). The principal purpose of the content is to provide factual information only for educational purposes. None of the content in this article, including any news, quotes, information, data, text, reports, ratings, opinions, images, photos, graphics, graphs, charts, animations, and video is or is intended to be, advisory in nature. The content does not contain or imply any recommendation or opinion intended to influence your financial decisions, including but not limited to, in respect of any particular security, transaction, or investment strategy, and must not be relied upon by you as such. The content is provided without any express or implied warranties of any kind. Kalkine Media, and its related bodies corporate, agents, and employees (Kalkine Group) cannot and do not warrant the accuracy, completeness, timeliness, merchantability, or fitness for a particular purpose of the content or the website, and to the extent permitted by law, Kalkine Group hereby disclaims any and all such express or implied warranties. Kalkine Group shall NOT be held liable for any investment or trading losses you may incur by using the information shared on our website.
