


Highlights
- Incannex Healthcare Limited (ASX:IHL) is a clinical-stage pharmaceutical development company
- This stock has corrected 61% in the last one year through 19 June 2023
- On Friday (16 June 2023), the company announced it recruited two lead principal investigators for a clinical trial investigating IHL-42X regarding the treatment of obstructive sleep apnoea
Shares of Incannex Healthcare Limited (ASX:IHL), a clinical-stage pharmaceutical development company engaged in the research and development associated with medicinal cannabinoid and psychedelic pharmaceutical products and therapies, have been on a downward trend since September 2022.
This stock has corrected 61% in the last one year through 19 June 2023. On Friday (16 June 2023), the company announced it recruited two lead principal investigators for clinical trial investigating IHL-42X regarding the treatment of obstructive sleep apnoea.
This trial is a critical step for the IND opening Phase 2/3 study. In addition, the company intends to recruit nearly 45 sites across multiple jurisdictions for this pivotal trial. Previously (on 30 May 2023), IHL also announced that three world-leading clinical psychedelics experts joined Clarion Clinics Advisory Board (which is a collaborative venture between IHL and three leading Australian psychedelics experts, who are co-founders). On 30 May 2023, the company also affirmed the oversubscription for the entitlement offer of loyalty options announced on 3 May 2023.
However, these updates could not help revers the ongoing downtrend of IHL shares. Let's study the stock's price chart to get an idea about its possible near-term movement.
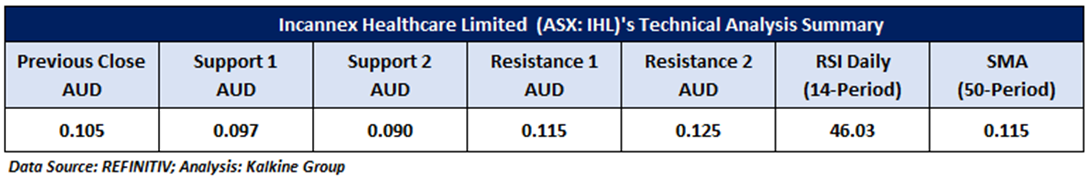
IHL’s Technical Analysis:
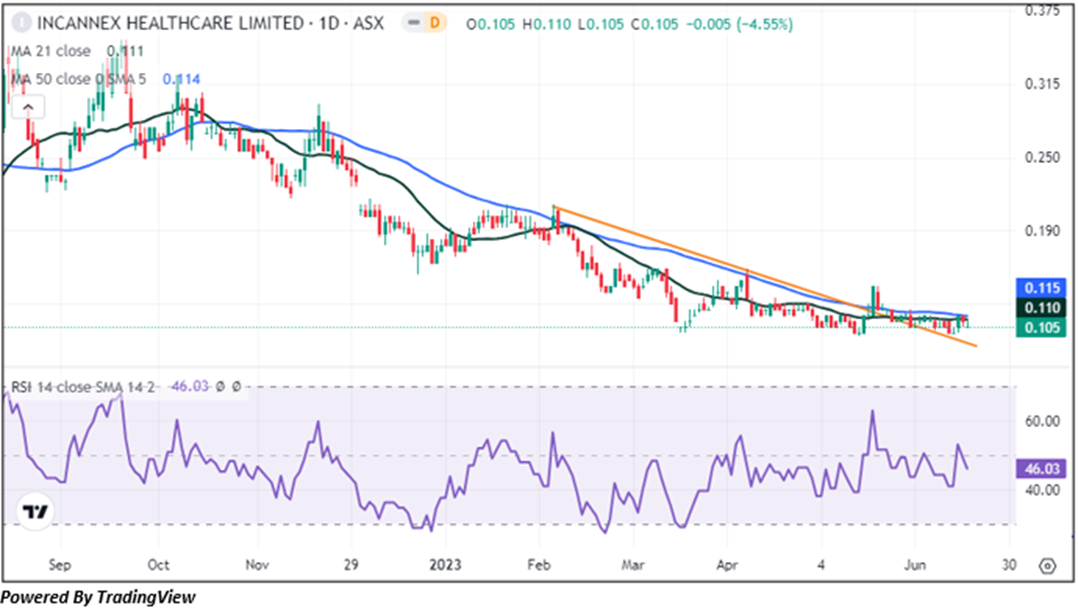
On the daily chart, IHL's price is confronting a short-term downward slope trendline established in Sep 2022; nonetheless, the stock is also developing bottom divergences compared to the relative strength index, which inclines to a positive bias. This suggests that if the stock manages to surpass the trendline, it has the potential to gain momentum to head higher. Prices are trading below both the 21-period and the 50-period SMAs, which may act as resistance levels for the stock; in contrast, the stock's most recent low might act as a support level. Important support for the stock is positioned at AUD 0.090, while key resistance is placed at AUD 0.125.
Daily Technical Chart – IHL
The technical levels for the stock were evaluated as per the closing price of AUD 0.105 per share, down 4.545%, as on 19 June 2023.
Note 1: Past performance is neither an Indicator nor a guarantee of future performance.
Technical Indicators Defined:
Support: A level at which the stock prices tend to find support if they are falling, and a downtrend may take a pause backed by demand or buying interest. Support 1 refers to the nearby support level for the stock, and if the price breaches the level, then Support 2 may act as the crucial support level for the stock.
Resistance: A level at which the stock prices tend to find resistance when they are rising, and an uptrend may take a pause due to profit booking or selling interest. Resistance 1 refers to the nearby resistance level for the stock and if the price surpasses the level, then Resistance 2 may act as the crucial resistance level for the stock.
Stop-loss: It is a level to protect further losses in case of unfavourable movement in the stock prices.
The Green colour line reflects the 21-period moving average. SMA helps to identify existing price trends. If the prices are trading above the 21-period, prices are currently in a bullish trend (Vice – Versa).
The Blue colour line reflects the 50-period moving average. SMA helps to identify existing price trends. If the prices are trading above the 50-period, prices are currently in a bullish trend (Vice – Versa).
The Orange/ Yellow colour line represents the Trendline.
The Purple colour line in the chart’s lower segment reflects the Relative Strength Index (14-Period), which indicates price momentum and signals momentum in trend. A reading of 70 or above suggests overbought status, while a reading of 30 or below suggests an oversold status.
Disclaimer
This article has been prepared by Kalkine Media, echoed on the website kalkinemedia.com/au and associated pages, based on the information obtained and collated from the subscription reports prepared by Kalkine Pty. Ltd. [ABN 34 154 808 312; AFSL no. 425376] on Kalkine.com.au (and associated pages). The principal purpose of the content is to provide factual information only for educational purposes. None of the content in this article, including any news, quotes, information, data, text, reports, ratings, opinions, images, photos, graphics, graphs, charts, animations, and video is or is intended to be, advisory in nature. The content does not contain or imply any recommendation or opinion intended to influence your financial decisions, including but not limited to, in respect of any particular security, transaction, or investment strategy, and must not be relied upon by you as such. The content is provided without any express or implied warranties of any kind. Kalkine Media, and its related bodies corporate, agents, and employees (Kalkine Group) cannot and do not warrant the accuracy, completeness, timeliness, merchantability, or fitness for a particular purpose of the content or the website, and to the extent permitted by law, Kalkine Group hereby disclaims any and all such express or implied warranties. Kalkine Group shall NOT be held liable for any investment or trading losses you may incur by using the information shared on our website.
