


Highlights
- Bigtincan Holdings (ASX:BTH) shares jumped 15% on Monday.
- Bigtincan said that it received confidential takeover approaches.
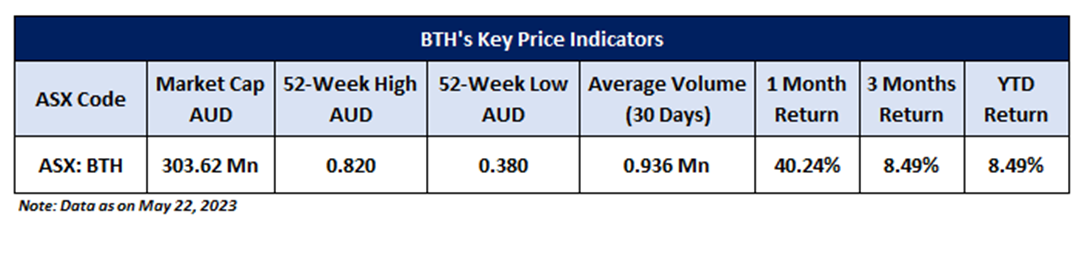
- BTH shares have rallied over 40% in the last one month till 22 May 2023.
Bigtincan Holdings Limited (ASX:BTH), which provides enterprise mobility software, had a stellar run on Monday, with its shares soaring 15%. Yesterday's buying in this ASX All Ords stock was witnessed after the company published its response to media speculations.
In an ASX announcement, BTH confirmed receiving a confidential, non-binding, incomplete and indicative takeover offer from Siris Capital Group, LLC, at an indicative offer price of AUD 0.80 per share. However, Bigtincan said that its independent board committee does not think Siris' proposal is in the best interests of shareholders to take it forward.
Bigtincan also said that it received other confidential approaches since that announcement, but there is no certainty that any such proposals will lead to a transaction.
Although there is no certainty about a deal, this announcement is certainly a sentiment booster. Including Monday's gains, BTH shares have rallied over 40% in the last one month till 22 May 2023.
Is further upside left in BTH shares given these developments? Let's study the price chart of Bigtincan Holdings Limited for insight.
BTH’s Technical Analysis:
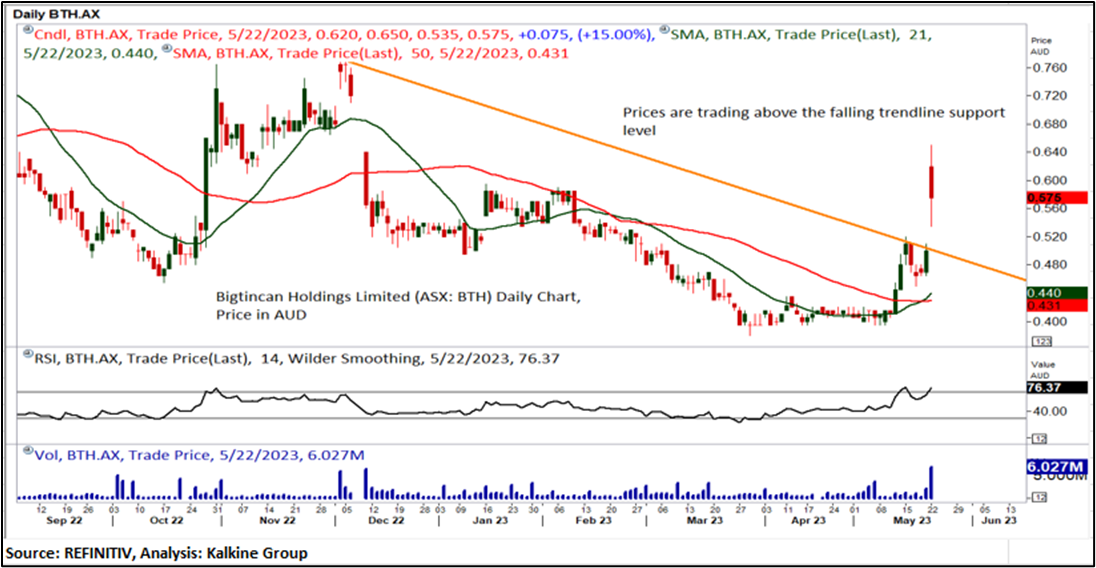
On the daily chart, BTH share price is sustaining above the downward-sloping trendline support level and continuously taking support from the trendline, supporting a positive bias. The stock could now head toward its next resistance level at AUD 0.66, and in the short term (2-4 weeks). An upside movement above AUD 0.66 level supported by volumes may take the stock to its next resistance level of AUD 0.73.
Daily Technical Chart – BTH
Powered by TradingView
The technical levels for the stock were evaluated as per the closing price of AUD 0.575 per share, up 15%, as on 22 May 2023.
Note 1: Past performance is neither an Indicator nor a guarantee of future performance.
Technical Indicators Defined:
Support: A level at which the stock prices tend to find support if they are falling, and a downtrend may take a pause backed by demand or buying interest. Support 1 refers to the nearby support level for the stock, and if the price breaches the level, then Support 2 may act as the crucial support level for the stock.
Resistance: A level at which the stock prices tend to find resistance when they are rising, and an uptrend may take a pause due to profit booking or selling interest. Resistance 1 refers to the nearby resistance level for the stock and if the price surpasses the level, then Resistance 2 may act as the crucial resistance level for the stock.
Stop-loss: It is a level to protect further losses in case of unfavourable movement in the stock prices.
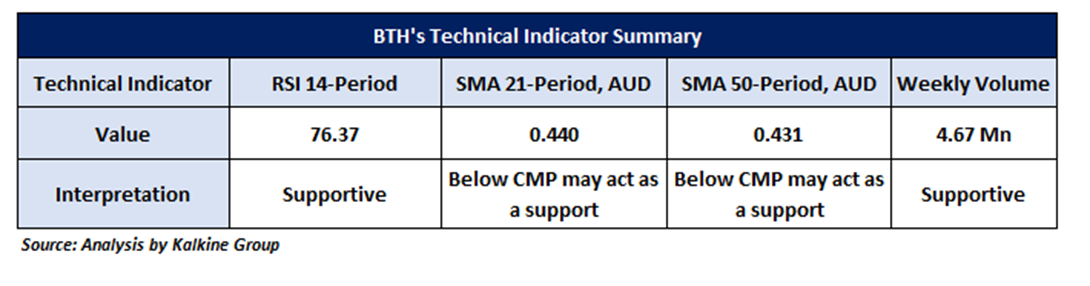
The Green colour line reflects the 21-period moving average. SMA helps to identify existing price trends. If the prices are trading above the 21-period, prices are currently in a bullish trend (Vice – Versa).
The Blue colour line reflects the 50-period moving average. SMA helps to identify existing price trends. If the prices are trading above the 50-period, prices are currently in a bullish trend (Vice – Versa).
The Orange/ Yellow colour line represents the Trendline.
The Purple colour line in the chart’s lower segment reflects the Relative Strength Index (14-Period), which indicates price momentum and signals momentum in trend. A reading of 70 or above suggests overbought status, while a reading of 30 or below suggests an oversold status.
Disclaimer
This article has been prepared by Kalkine Media, echoed on the website kalkinemedia.com/au and associated pages, based on the information obtained and collated from the subscription reports prepared by Kalkine Pty. Ltd. [ABN 34 154 808 312; AFSL no. 425376] on Kalkine.com.au (and associated pages). The principal purpose of the content is to provide factual information only for educational purposes. None of the content in this article, including any news, quotes, information, data, text, reports, ratings, opinions, images, photos, graphics, graphs, charts, animations, and video is or is intended to be, advisory in nature. The content does not contain or imply any recommendation or opinion intended to influence your financial decisions, including but not limited to, in respect of any particular security, transaction, or investment strategy, and must not be relied upon by you as such. The content is provided without any express or implied warranties of any kind. Kalkine Media, and its related bodies corporate, agents, and employees (Kalkine Group) cannot and do not warrant the accuracy, completeness, timeliness, merchantability, or fitness for a particular purpose of the content or the website, and to the extent permitted by law, Kalkine Group hereby disclaims any and all such express or implied warranties. Kalkine Group shall NOT be held liable for any investment or trading losses you may incur by using the information shared on our website.
