


In this article, we discuss two REITs from the real estate sector in Australia. These two REITs have reported the full-year results for the year FY2019 on 21 August 2019. Both these REITs distribute income quarterly. Specifically, Aventus Group (ASX:AVN) is engaged in the management of retail real estate assets, which includes shopping malls, stores etc. Whereas, APN Industria REIT (ASX:ADI) is engaged in the management of industrial real estate assets, which includes office parks, technology hubs etc.
Aventus Group (ASX: AVN)
On 21 August 2019, the group announced results for the year ended 30 June 2019. Accordingly, the revenues were up by $2.7 million or 1.6% to $167.3 million for the year FY2019 over FY2018. The net profit after tax attributable to securityholders was down by 18.6% or $25.2 million to $110.4 million for the year 2019 against the previous corresponding period. Meanwhile, Funds from Operations (FFO) was up by 8.2% to $96.2 million in FY2019 compared with $89 million in the FY2018.
Reportedly, the increase in revenues was attributed to increased rental income, other property income, and property management fees from the management of Kotara Home (North) for the period started 1 October 2018 to 30 June 2019. The Net tangible assets (NTA) per security was down to $2.15 as of 30 June 2019 compared to $2.38 as of 30 June 2018.
Meanwhile, the $25.2 fall in net profits was attributed to the decrease in net fair value gains on investment properties, increase in fair value losses on interest rate swaps, increase in interest costs, decrease in transaction costs, decrease in property expenses, decrease in management and performance fees, and increase in expenses resulting from the internalisation of management. Below figures provides information on the distribution by the group.
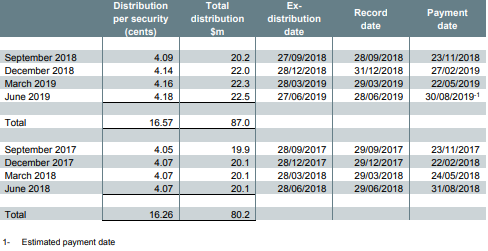
Distributions (Source: AVNâs Annual Financial Report)
Investment Property Portfolio: As per the release, the group owned 20 large format retail investment properties across Australia with a combined value of $1.97 billion as of 30 June 2019, and the weighted average capitalisation rate of the portfolio was 6.7%. Besides, the net fair value gains on the portfolio for the year ended 30 June 2019 was $39.5 million compared with $78.2 million in 2018.
Meanwhile, the group opened level 1 at Tuggerah Super Centre and added approximately 10k square metres of additional GLA to the centre. Besides, pad sites at Cranbourne Home and Bankstown Home were opened, while development works commenced at MacGregor Home, Logan Super Centre and Caringbah Home.
Debt Portfolio: Reportedly, the gearing increased from 35.6% as of 30 June 2019 to 38.7% as of 30 June 2019, and this was attributed to the acquisition of APG group on 1 October 2018. Besides, the management of the group is considering initiatives to manage gearing in the future financial periods.
As per the release, the maturity dates of $400 million of debt under syndicated bank debt facilities were extended by an additional 12 months. $60 million of new five year bi-lateral debt facilities were entered in July 2018, and the proceeds were used to repay a portion of debt under the syndicated bank debt facility.
Besides, the group had finalised $50.0 million expansion of the syndicated loan note facility in September 2018, and the proceeds were used to repay debt under the syndicated bank debt facility. It permanently repaid the Tranche B of the syndicated bank debt facility in September 2018.
Meanwhile, tranche A of the syndicated debt facility was refinanced and replaced with $200.0 million of bi-lateral bank debt facilities in March 2019. Tranche A was permanently repaid in March 2019, and the new bi-lateral facilities would expire in October 2023.
Consequently, these refinancing activities mean no debt expiry before May 2022, and the debt maturity profile as of 30 June 2019 is in the below figure.
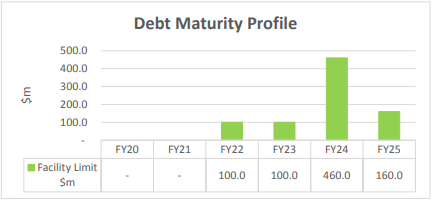
Debt Maturity Profile (Source: AVNâs Annual Financial Report)
Asset Performance: Reportedly, the opportunities to improve the range of offerings for shoppers through tenant remixing resulted in the negotiation of 141 leases covering 108k sqm with an occupancy rate of 98.4% across the portfolio. Besides, these leases were achieved with positive leasing spreads, low incentives, and delivered strong like-for-like NOI growth of 3.5%.
Meanwhile, the group has been focusing on everyday needs, products and services such as food, health and wellbeing while introducing new tenants. Further, over 70% of the 33 tenants introduced to the portfolio were from Everyday needs category.
Outlook: Reportedly, the focus of the group for the ongoing 12 months period is to actively diversify the tenant base with priority on increasing everyday-needs to improve the weekday traffic while energising the groupâs centres. Besides, the group intends to continue investments in the development and expansion of the portfolio to improve shopper experience while tapping the attractive development returns.
Further, the group would maintain efficient capital management to enable the implementation of its strategies. More importantly, considering the prolonged momentum from the portfolio, the group expects FFO per security growth of 3-4% or 19 -19.2 cents per security in FY20.
On 22 August 2019, AVNâs stock was trading at A$2.655, up by 2.51% (at AEST 1:08 PM).
APN Industria REIT (ASX: ADI)
On 21 August 2019, the group reported full-year results for the period ended 30 June 2019. Accordingly, the total revenue from continuing operations were up by 7.01% to $55.3 million in FY2019 compared with $51.67 million in FY2018. Besides, the net profit attributable to members was $29.24 million in FY2019 down by 39.28% compared to $48.15 million in FY2018.
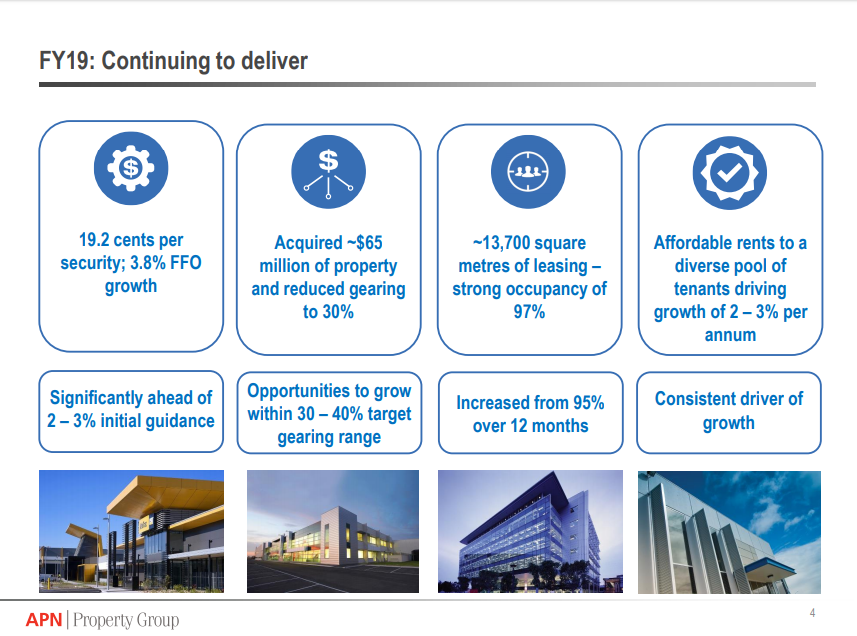 FY19 Highlights (Source: ADIâs FY2019 Results Presentation)
Meanwhile, the EPS for the period was 17.79 cents compared with 29.56 cents in FY2018. Further, Funds From Operations (FFO) increased by 5% to $31.6 million in FY2019 compared with $30 million in FY2018.
Reportedly, the net tangible assets (NTA) per unit was $2.71 as of 30 June 2019 compared with $2.7 as of 30 June 2018. The group distributed 17 cents per security during the year FY2019 compared with 16.5 cents per security in FY2018.
Besides, the fall in net profit was driven by non-cash accounting related adjustment, including fair value, straight-lining and tax items, and these items were $19.9 million lower compared to the previous full year 2018.
Meanwhile, the FFO increase of approximately $1.5 million was attributable to revenue from contracted leases across the portfolio, new leasing, and new acquisitions, increasing rental by 9.2%. The NTA gains on 1 cent were due to valuation gains of $10.8 million, which were offset by stamp duty costs on new acquisitions, and derivative fair value movements of $8.5 million.
Property Portfolio: Reportedly, the group had improved on portfolio diversity and scale in FY2019 backed by the acquisition of seven properties for $64.5 million, with an average WALE being 4.9 years with long-standing successful businesses with an attractive average yield of 6.6%.
Besides, the group witnessed record levels of leasing activity in FY2019 supported by 53 deals across 13,700 square metres. The company has been focusing on client needs, which helped to generate higher volumes while improving the depth of the tenant base.
Meanwhile, the group has been focusing on sustainability, in this regard, it installed over 1.8 megawatts of solar, which provides an average of 52% of power consumption during peak energy periods. These investments have been generating yield on cost exceeding 15% while reducing the carbon footprint by over 720 tonnes.
Further, the group is undertaking lighting and air conditioning upgrades to reduce dependency on gases that adversely impact the environment. The company undertook independent valuations across 53.4% of the portfolio, which improved valuations by $16.4 million over the prior independent valuations.
Overview & Outlook: Reportedly, the portfolio consists of over 80% of leases with fixed annual reviews of 3% or more, and the revenue is based on pure rents received, which reduced the volatility of income stream. The company is carrying a gearing of 30%, which is at the lower end of the group range of 30-40%.
Besides, a low gearing provides flexibility to pursue potential acquisition opportunities. The group has been allocating capital with discipline over the recent period and considers opportunities with the ability to generate growing income stream over the long term.
More importantly, subject to consistent current market conditions with no unforeseen events, the groupâs distribution forecast is to be 17.5 cents per security, which is a 3% increase over FY2019. The group expects full year FFO guidance of 19.7 to 19.8 cents per security, which depicts 2.5 â 3% rise over FY19 period.
On 22 August 2019, ADIâs stock was trading at A$2.930, up by 0.687% (at AEST 1: 24 PM).
Disclaimer
This website is a service of Kalkine Media Pty. Ltd. A.C.N. 629 651 672. The website has been prepared for informational purposes only and is not intended to be used as a complete source of information on any particular company. Kalkine Media does not in any way endorse or recommend individuals, products or services that may be discussed on this site. Our publications are NOT a solicitation or recommendation to buy, sell or hold. We are neither licensed nor qualified to provide investment advice.
