


The Gold spot is again back in action with prices of the spot surging from the level of USD 1,670.06 (intraday low on 1 May 2020) to the present level of USD 1,719.59 (as on 14 May 2020 12:18 PM AEST), marking a price gain of ~ 2.96 per cent after giving a breakdown below the symmetrical triangle pattern seen on the daily chart.
To Know More, Do Read: Gold- Is a Reversal on the Cards as Central Banks Go Slow on Buying?
In the status quo, the global market participants again seems to be favouring gold to safeguard their investment portfolio as the equity market across the globe tumbled again post the United States Federal Reserve Jerome Powell warned of dire consequences on the economy if lawmakers do not adopt protective measures on the economic front.
COVID-19 outbreak has affected many sectors due to the lockdown or restrictions imposed by various governments worldwide to contain the spread of the virus.
The U.S. Fed Chair Jerome Powell, in his recent economic speech, suggested that the magnitude and rapidity of the current downturn are without any modern precedent and it is considered the worst, even more than the recession led by the 2008 Financial Crisis.
The unemployment rate across the globe is on the surge, while many Central banks, including RBA, anticipating that unemployment would again peak in June to July 2020. Mr Powell mentioned that the COVID-19 outbreak has already erased job gains of the past decade, and suggested that over 20 million jobs have been compromised, while those who are working, are seeing a cut in earnings which as per the data from Fed Research, almost 40 per cent of people, who worked in February 2020 and making less than USD 40,000 a year and eventually lost their jobs in March 2020.
The Fed chair suggested that the unprecedented reversal in economic conditions has served a level of pain, which would be inexplicable, while the future remains uncertain.
The Fed chair further mentioned that the current downturn differs from the one faced by the U.S. in past as the earlier trend was a recession followed by higher inflation and then by the Fed tightening. However, Fed suggested that the lower inflation witnessed in the recent decade has cascaded into a series of expansion, leading to an unstoppable level of asset prices, for example, the housing sector, which materially boomed across the United States.
However, Fed suggests that this outbreak and the recession like situation caused by it is different in a sense that, at present, high inflation is not a problem, and there is no bubble or unsustainable bust.
In the wake of the economic warning, the gold spot again took a jump during the evening trading session of 13 May 2020, with spot spiking ~1.52 per cent against its previous low to reach a high of USD 1,715.99.
However, the Fed chair also suggested that the Congress has provided ~ USD 2.9 trillion of fiscal support for various stakeholders of the economy, including but limited to households, businesses, and state governments, which represents roughly around 14 per cent of the Gross Domestic Product.
While there has been a lot of liquidity or speedy lending has provided by the Federal Reserve and by many other Central banks across the globe to boost the economy, nothing at present, seems to be boosting the consumer confidence, which is further leading to a restricted consumption worldwide.
To Know More, Do Read: Crude Soars on Slightest Indication of Demand; Oil is not out of the Woods yet
Gold and USD Fighting for the Safe Haven Tag
While gold is considered as a typical safe haven due to its property to appreciate in price in the wake of economic contraction or geopolitical turmoil, the United States dollar is also being considered equally safe by the investing community from time-to-time.
In the status quo, both gold and DXY are showing somewhat similar price behaviour and pattern on charts.
- Gold on Charts
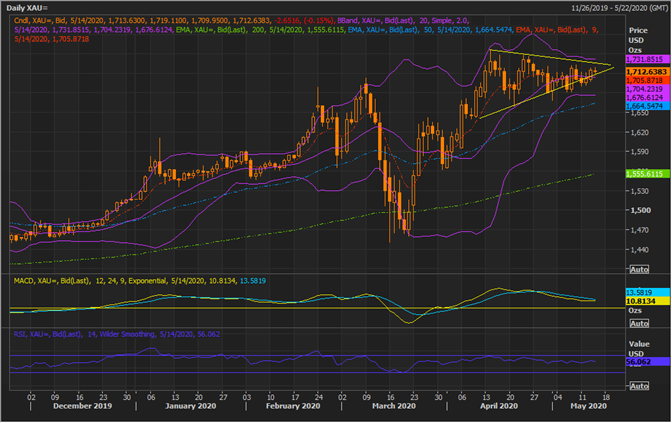
XAU Daily Chart (Source: EODHD/Others Thomson Reuters)
On the daily chart, it could be seen that the gold spot gave a breakdown below the symmetrical triangle leading to a negative signal from the 12,26,9 Moving Average Convergence and Divergence or MACD indicator.
However, bulls quickly dominated the price action, and currently, gold is trading above its short-term 9-day exponential moving average and is currently moving towards the +1 standard deviation of the 20-day Bollinger band. Also notice, that the 9-day EMA is now trading above the mean value of the Bollinger, suggesting that the gold market responded positively to the economic warning and comments made by the United States Federal Reserve Chair- Jerome Powell.
At present, the -1 SD is above the 50-day EMA, while prices are quite above the 200-EMA leading to a bullish setup; however, the resistance line of the triangle and the +1 SD of the Bollinger band coinciding, suggesting that it could turn out to be a strong resistance and a decisive level for the gold momentum ahead.
The 14-day Relative Strength Index, which is above its mean value is in tandem with the current swing in the gold prices.
- DXY on Charts
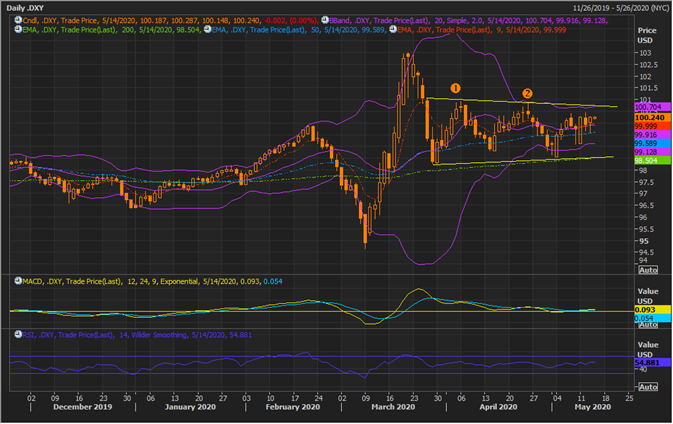
DXY Daily Chart (Source: EODHD/Others Thomson Reuters)
On the daily chart, it could be seen that the dollar index is now under the third swing or attempt to test and break the channel in which the index has been trading for quite a while. The index has made two attempts to breakout, and as per the classical theory of technical analysis, if the third swing fails in an attempt to break the channel, it would further invite bearish sentiments, leading to a fall.
Currently, the upper line of the channel and +1 SD of the Bollinger band are coinciding, suggesting that the resistance level holds significant importance and a break above and sustain or failure to do so would decide further price action in it.
Currently, the index is trading above the mean value of the Bollinger, which is below 9-day EMA, suggesting that the market turned out bullish in the short-run over the index; however, the spread between the mean value of the Bollinger band and 50-day EMA is now narrowing down, while the 200-day EMA is overlapping with the lower line of the channel, making it strong and decisive support for the index.
The 14-day Relative Strength Index, which is above its mean value is again in tandem with the current swing gained by the price pattern.
Also Read: Silver to Reach USD 19.0 Per Ounce by Year-End- Says The Silver Institute
