


Amcor Plc and Orica Limited from the materials sector, consumer discretionary company Kathmandu Holdings Limited and Viva Energy Limited from the energy sector, are all leading companies in their respective domains and have also declared good dividends over the last one year along with a positive YTD stock return. Letâs take a detailed look at what makes these companies popular amongst the investors.
Amcor Plc
Amcor Plc (ASX: AMC), headquartered in the United Kingdom, is a well renowned developer and producer of flexible packaging for different products including pharmaceutical, food, beverage, medical, home- and personal-care, and others. The company is focused on creating lightweight, recyclable and reusable packaging.
The company employs a staff of over 50,000 to generate USD 13 billion in sales from operations spanning across 250 locations in over 40 countries.
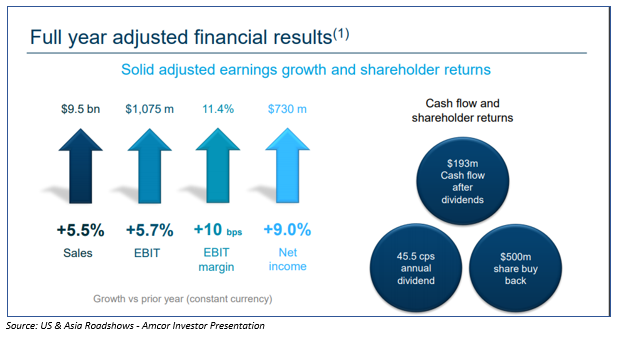
FY19 Results â Recently on 25 September 2019, Amcor Plc disclosed its financial results for the full year ended 30 June 2019, posting the GAAP net income of USD 430.2 million and the adjusted net income of USD 729.5 million, up 9% in constant currency terms. The sales for FY19 amounted to USD 215.4 million and the legacy Bemis businesses generated adjusted net income of USD 14.3 million.
The companyâs adjusted EBIT for the FY19 stood at USD 1.075 billion, which is 5.7% higher in constant currency terms than FY18. The companyâs adjusted cash flow after payment of dividends was around USD 192.7 million.
During the June 2019 quarter, Amcor closed the acquisition of Bemis Company, Inc. on 11 June 2019 and as per the agreement signed in August 2018, the all-stock acquisition was executed at a fixed exchange ratio of 5.1 Amcor shares for each Bemis share.
The company also declared a dividend of USD 0.120 on its AMC - CDI 1:1 FOREIGN EXEMPT NYSE security (Record Date: 11 September 2019; payment Date: 8 October 2019).
Amcor has moved into the financial year 2020 (FY20) with good momentum and is on track to achieve its previously stated $ 180 million (pre-tax) of synergy benefits by the end of FY22.
Stock Performance â Amcorâs market cap stands at ~AUD 23.19 billion with ~ 1.63 billion shares outstanding. On 27 September 2019, the AMC stock price settled the dayâs trading at AUD 14.335, up 0.5% relative to its last trade. Besides, the AMC stock has delivered a positive return of 7.46% YTD.
Orica Limited
Orica Limited (ASX: ORI) offers commercial explosives and advanced blasting systems to the quarrying, mining, oil & gas and construction marketplaces. Besides, it also supplies sodium cyanide for gold extraction along with specialist ground support services in mining and tunnelling activities. Recently on 30 August 2019, Orica declared the retirement of Mr Ian Cockerill from its Board of Directors, effective 30 August 2019.

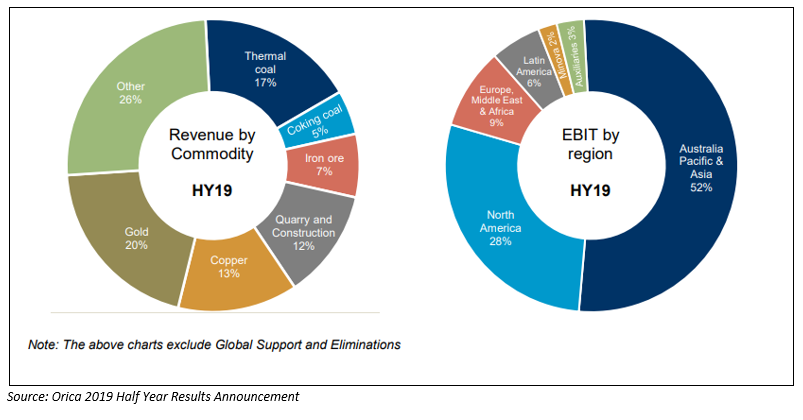
Half-Year 2019 Results â On 9 May 2019, Orica announced a Statutory Net Profit After Tax (NPAT) of AUD 33 million for the six months to 31 March 2019 and the NPAT of AUD 167 million, before individually significant items, was increased by 35% on the prior corresponding period (PCP).
Oricaâs Managing Director Alberto Calderon commented on the results stating that in the first half of FY19, the company delivered higher Ammonium Nitrate (AN) volumes, reflecting an increase of 3%, and 12% increase in sales revenue that drove an EBIT growth of 20%. The higher sales revenue was primarily driven by higher volume of products and services, introduction of new technologies, favourable movements in the foreign exchange market and high input commodity prices.
The company also paid out a final dividend of AUD 0.22 for the six monthsâ period ended 31 March 2019 (Record Date: 31 May 2019; Payment Date: 1 July 2019). The dividend represents a pay-out ratio of 50% and the Board stated that the full year dividend may be partially franked.
Stock Performance â Oricaâs market capitalisation is around AUD 8.59 billion with ~ 380.58 million shares outstanding. On 27 September 2019, the ORI stock settled the dayâs trading at AUD 22.800, up 0.97% by AUD 0.220 with ~ 1,166,016 shares traded. In addition, ORI has delivered positive returns of 33.61% YTD, 24.07% in the last six months and 10.25% in the last three months.
Kathmandu Holdings Limited
Kathmandu Holdings Limited (ASX:KMD) operates a transnational string of retail stores that provide adventure and travel outdoor apparel along with equipment across ANZ and the United Kingdom.
FY19 Results â Recently on 18 September 2019, Kathmandu Holdings disclosed its financial results for the 12 months to 31 July 2019 with the following key highlights-
- Successful execution of the multi-channel, brand led growth strategy.
- The companyâs Summit Club members increased to 2.2 million (up 12.4%).
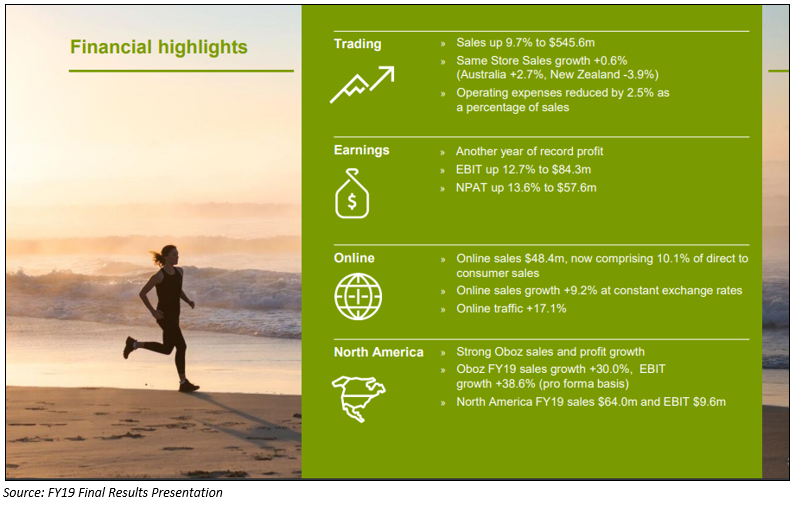
- Sales for the year were up 9.7% to NZD 545.6 million.
- The same store sales growth were up 0.6% at constant exchange rates, with Australian same store sales growth increasing by 2.7%.
- For the North American business, Oboz, the sales rapidly grew by 30.0% to USD 44.6 million in FY19.
- Online sales were also considerably up 9.2% at constant exchange rates to NZD 48.4 million; now comprising 10.1% of direct to consumer sales.
- Kathmanduâs gross profit improved by 5.4% to NZD 332.5 million.
- There was a 12.7% increase in the EBIT to NZD 84.3 million while the FY19 NPAY also increased by 13.6% to NZD 57.6 million.
- The companyâs operating cash flow stood at NZD 61.7 million, with a strong operating cash flow of NZD 77.9 million in the second half of FY19.
- The company also announced a final FY19 fully imputed/franked dividend of NZD 0.12 per share; which takes the full year pay-out to a high of NZD 0.16 per share.
Although the total sales in Kathmanduâs largest market, Australia were up 4.5%, there was a decline of 3.1% in the sales across New Zealand.
For the first seven weeks of FY20 ending 15 September 2019, Kathmanduâs same store sales grew at 6.1% (constant exchange rates). The same store sales were up 4% in Australia and 11.7% in the New Zealand for this period (albeit at lower gross margins).
Stock Performance â Kathmandu holdings has a market cap of around AUD 646.21 million with ~ 226.74 million shares outstanding. On 27 September 2019, the KMD stock settled the dayâs trading at a price of AUD 2.790, down 2.1% by AUD 0.060 with ~ 124,356 shares traded.
Besides, KMD has also delivered positive returns of 8.78% YTD, 33.80% in the last six months and 37.02 in the last three months.
Viva Energy Group Limited
Australia-based leading Energy sector player, Viva Energy (ASX: VEA) caters to around one fourth of the total liquid fuel requirements of the country as it is the sole provider of high-quality Shell fuels and lubricants through a sprawling network of over 1,250 Shell branded service stations.
Re-affirmation of Credit Rating - Recently, Viva Energy announced that S&P Global Ratings had confirmed Viva Energyâs long-term issuer credit rating at âBBB-â, while also revising the outlook from stable to negative, reflecting the challenging industry conditions. However, VEAâs debt terms are not contingent on a specific credit rating, and the amended outlook would not change the borrowing conditions. Viva Energy also added that its structural long-term debt stands at zero and its net debt as of 30 June 2019 was AUD 168.7 million.
Half-year Results 2019 â For the half year ended 30 June 2019, Viva Energy recorded total sales volume of 7,126 million litres, up ~2.5% on the prior corresponding period (PCP). The refining operational availability stood at 94% while the refining intake of 21.4 mbbls was up 12% on PCP.
The diesel production was at a record 40% of total production, up from 36% in financial year ended 31 December 2018 (FY2018).
The companyâs Underlying EBITDA of AUD 171.6 million was recorded at the upper end of June 2019 guidance range of AUD 150 â AUD 180 million while the underlying NPAT (RC) was at AUD 78.0 million, also at the upper end of June 2019 guidance range of AUD 60 â AUD 80 million.
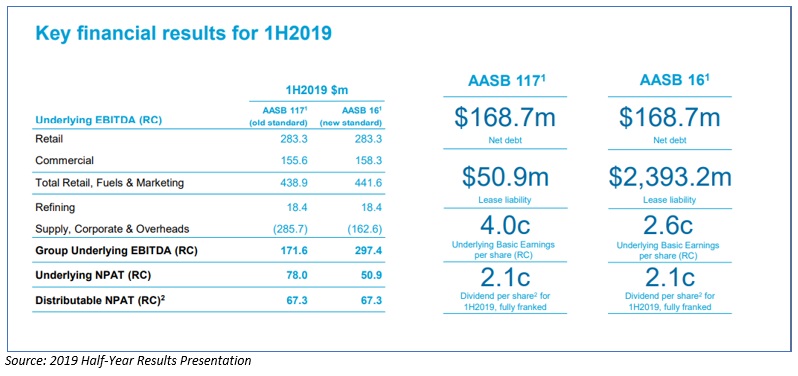
The companyâs net debt stood at AUD 168.7 million. The company also declared an ordinary fully paid dividend of AUD 0.021 for the six months to 30 June 2019 (Record Date: 27 September 2019; Payment Date: 14 October 2019).
Stock Performance â Viva Energy has a market capitalisation of AUD 3.71 billion with ~ 1.94 billion shares outstanding. On 27 September 2019, the VEA stock settled the dayâs trading at AUD 1.950, up 2.09% by AUD 0.040. Besides, the VEA stock has delivered a positive return of 9.46% YTD.
Disclaimer
This website is a service of Kalkine Media Pty. Ltd. A.C.N. 629 651 672. The website has been prepared for informational purposes only and is not intended to be used as a complete source of information on any particular company. Kalkine Media does not in any way endorse or recommend individuals, products or services that may be discussed on this site. Our publications are NOT a solicitation or recommendation to buy, sell or hold. We are neither licensed nor qualified to provide investment advice.
