


Exploration and mining companies contribute to a major part of the Australian economy, aided by availability of wide range of minerals across the country. Apart from the infamous names across the mineral and mining businesses, Investors can look around for some mining and exploration companies within the midcap and small cap categories. Letâs have a look at the following businesses.
Northern Star Resources Ltd (ASX: NST)
Northern Star Resources Ltd is engaged in production and exploration of gold along with other minerals. On 18 December 2019, the company reported that it has done an underwritten placement of $765 million to the institutional investors. The funds are likely to be used for purchasing 50% stake in Kalgoorlie Consolidated Gold Mines Pty Ltd.
FY19 Operational Highlights for the period ended 30 June 2019: NST announced its full year results, wherein the company reported revenue at $1401.165 million as compared to $964.025 million in previous financial period. The company announced EBITDA of $479.735 million as compared to $443.268 million in FY18 aided by strong operating cash flow from all operations. The company reported net profit of $154.711 million as compared to $194.113 million in previous financial year. Exploration expenses stood at $87.168 million as compared to $45.373 million in FY18. The company reported higher cost of sales at $1,101 million, up 77% from FY18 on account of increase expense related to acquisition of Pogo along with increase of production in Australian Operations.
Stock Update: The stock of NST closed at $10.775, up 3.209% with a market capitalization of $6.77 billion on 20 December 2019. The stock is available at a price to earnings multiples ratio of 42.79x on trailing twelve months (TTM) basis. The stock has generated negative returns of 5.35% and 2.43% in the last three months and six-months, respectively. At current market price, the stock has generated an annualized dividend yield of 1.29%.
Oil Search Limited (ASX: OSH)
Oil Search Limited operates in exploration, development and production of oil and gas. Recently, the company updated regarding the material progress made on Pikka Unit Development, Alaska North Slope, with primary resource upgrade. The company made Land Use Agreement with Kuukpik Corporation, the representative native corporation and representative landowner for Nuiqsut, the community located nearest the project area. The agreement states the foundation for a long-term relationship with Kuukpik where the group is focused on ensuring that the Pikka Unit is developed in a balanced and environmentally sensitive manner.
Q3FY19 Operational Highlights for the period ended 30 September 2019: OSH announced its third quarter highlights for FY19 wherein the company reported total production of 6.81 mmboe, down 1% on y-o-y basis. The business reported total revenue of US$361.1 million as compared to US$474.9 million in previous corresponding quarter. The business reported total volumes sales of 6.47 mmboe as compared to 7.44 mmboe in Q3FY18.
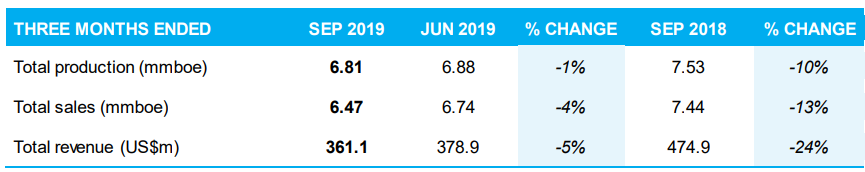
Q3FY19 Production Highlights (Source: Company Reports)
The company reported average oil and condensate realized price of US$59.54 per barrel, 13% lower than previous quarter due to weakness in global oil prices and a different product mix, with higher condensate volumes relative to crude oil during the mooring buoy disruption. At 30 September 2019, the company held liquidity of US$1.18 billion, including US$547.3 million of cash followed by US$635.7 million in undrawn corporate credit facilities.
Stock Update: The stock of OSH closed at $7.415, down 0.336% from its previous close, on 20 December 2019. The stock has generated returns of -2.11% and 3.91% in the last three months and six months, respectively. At current market price, the stock is trading at a market capitalization of ~11.34 billion. The stock is available at a P/E multiple ratio of 18.67x on TTM basis. The stock has delivered an annualized dividend yield of 2.61%.
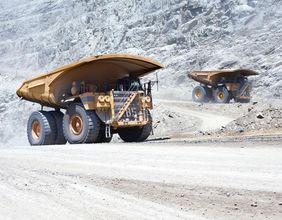
Jupiter Mines Limited (ASX : JMS)
Jupiter Mines Limited is a mining company operates in the Tshipi Manganese Mine in South Africa and engaged in the marketing of manganese ore.
Q3FY20 Operational Highlights for the period ended 30 November 2019: JMS declared its quarterly updates, wherein the company reported sales revenue of $142.5 million as compared to $ 181.8 million in Q3FY19. Total Mined volume and total production stood at 3,360,482 bcm and 764,226 tonnes, respectively as compared to 2,872,951 bcm and 789,922 tonnes in Q3FY19, respectively. The company is positive on overall annualised sales of Tshipi and the company is expecting to meet FY2020 target. Despite lower commodity price of manganese, the company reported positive cash balance along with low cost of production. The company reported overall sales volumes at marginally higher than the companyâs production level. Rail volumes came a bit lower on account of some issues with one of the routes leading to the port. The above has been rectified and regular service is expected to continue from December 2019. Road volumes were ahead due to low-grade product moved in additional quantities.
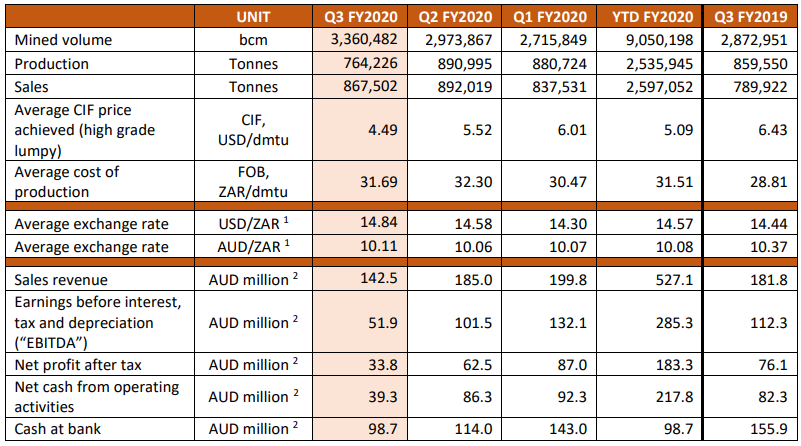
Q3FY20 Production Update (Source: Company Reports)
Stock Update: The stock of JMS closed at 0.297, up 2.414% as on 20 December 2019. The stock is trading at a market capitalization of ~568.11 million. The stock has generated negative returns of 29.27% and 21.62% in the last three-months and six-months respectively.
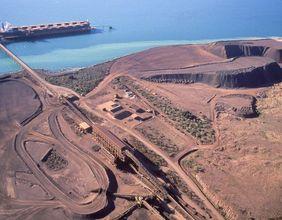
Pilbara Minerals Limited (ASX : PLS)
Pilbara Minerals Limited is engaged in exploration and mine development of Lithium and tantalum. Recently, the company reported options granted pursuant to the companyâs employee award plan wherein the company issued options of 18,892,603.
Quarterly Cash Flow Highlights for the period ended 30 September 2019: PLS announced its quarterly cash flow statement, wherein the company reported net cash used in operating activities at $28.761 million which includes receipts from customers at $14.637 million, exploration & evaluation of $1.057 million, production costs of $33.012 million, staff costs of $2.633 million. The company reported net cash used in investing activities $11.49 million and net cash from financing activities at $37.82 million. The company reported cash and cash equivalent as on 30 September 2019 at $60.896 million.
Guidance: As per the cash-flow guidance for the next quarter, the company expects, total cash outflows of $52.999 million including production costs of $33.583 million, staff costs of $2.179 million and Capital - operating capital, feasibility costs and mine properties in development of $8.893 million.
Stock Update: The stock closed at $0.260 on 20 December 2019, flat compared to the previous dayâs closing. The market capitalization of the stock is at ~$578.16 million. The stock has corrected by 24.64% and 52.29% in the last three months and six-months, respectively.
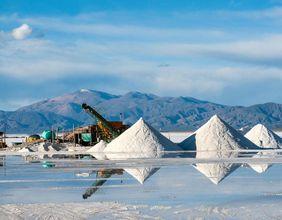
Orocobre Limited (ASX : ORE)
Orocobre Limited is engaged in exploration of Minerals and production of Lithium/Potash resources in Argentina. Recently, the company reported change in directorâs interest wherein, one of the directorâs named MartÃn Pérez de Solay purchased 132,818 ordinary shares.
December 2019 Quarter Lithium Carbonate Pricing Update: The highlights are given below:
- The company indicated US$5,400/tonne to be the weighted average price of lithium carbonate for the December quarter.
- Market conditions have remained weak and Orocobre has made the decision to conform to current pricing to ensure protection of market share.
- For the quarter, lithium chemical prices are well below incentive pricing for green-field projects but are expected to recover in the medium term.
- The management reported sales for the March 2020 quarter are likely to remain under negotiation and ORE will provide an update of the expected weighted average price as part of the regular reporting schedule in the new year.
Stock Update: The stock of ORE closed at $2.735 with a market capitalization of ~717.36 million on 20 December 2019. The stock has generated positive returns of 2.24% and 4.98%in the last one month and three-months, respectively. The stock is available at a P/E multiple of 9.19x on trailing twelve-month basis.
Disclaimer
This website is a service of Kalkine Media Pty. Ltd. A.C.N. 629 651 672. The website has been prepared for informational purposes only and is not intended to be used as a complete source of information on any particular company. Kalkine Media does not in any way endorse or recommend individuals, products or services that may be discussed on this site. Our publications are NOT a solicitation or recommendation to buy, sell or hold. We are neither licensed nor qualified to provide investment advice.
