


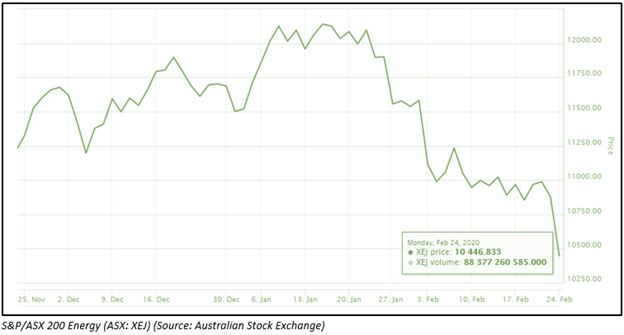
Come 2020, world economy witnessed substantial ambiguity over crude oil price. The S&P/ASX 200 Energy index first increased from November 2019 to January 2020 due to the US-Iran tensions and postponement of US-China trade discussions due to the US 2020 presidential election.
Later, the index fell by ~14% from maximum 12139.26 on 15 Jan 2020 to 10446.80 on 24 Feb 2020 as shown below due to the northern hemisphere’s hotter-than-normal temperatures across most of the region in January 2020 lowering the need of oil for heating and outbreak of Coronavirus hampering the economic growth.
Similarly to the XEJ index, the Brent crude oil front-month futures price tumbled by 17% from US$66.25 per barrel (b) on 2 Jan 2020 to US$54.93/b on 6 Feb 2020 and during the same interval, Cushing, Oklahoma for West Texas Intermediate (WTI) crude oil declined from US$61.18/b to US$50.95/b. On 24 Feb 2020, the price of Brent and WTI crude oil closed at US$56.3/b and US$51.43/b, respectively.
Interesting Read: Is China to blame? Demand for Crude Oil & Distillate Products Down.
Therefore, it would be interesting to know how oil & gas (O&G) stocks have performed in the environment of uncertainty. For the same, the stock selection has been made randomly with the market share ranging below A$1billion to A$10billion.
For VEA, COE and WOR, the last three-month returns, as on 25 Feb 2020, stood at -13.96%, -5.56% and -1.63%.
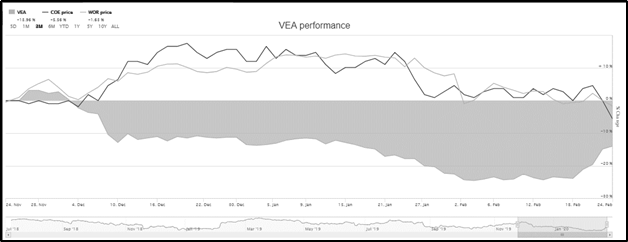
Source: Australian Stock Exchange as on 25 Feb 2020
Energy Players’ Performance
Viva Energy Group Limited (ASX: VEA) is one of the leading energy companies, focusing on manufacturing, importing and delivering products such as fuels, lubricants, bitumen and chemicals. VEA helps truck drivers move freight around the country and equipment operators in the aviation, mining and marine industries.
The company owns and operates the Geelong oil refinery, which contributes over 10% towards the total Australian fuel supply and accounts for more than 50% fuel used in Victoria.
- Financial Performance
In FY19 ended 31 Dec 2019, fuel sales volume went up by 4.6% from the previous corresponding period (pcp) to 14,695ML. However, underlying EBITDA fell by 17% to A$644.5 million, signifying a rise in operational expenditure. The capital expenditure during the period tumbled by 33% from the pcp to A$161.7 million. High operational expenditure during the year can be attributed to the lower margin on refining owing to soaring oil prices and enhanced market competition impacting earnings.
- Stock Performance
In the last three-month period, stock of VEA fell by ~26.2% from A$2.29 on 28 Nov 2019 to A$1.69 on 18 Feb 2020, since then the price started correcting to A$1.91 on 24 Feb 2020. The improvement can be attributed to the sale of a stake in VIVA Energy REIT (ASX:VVR) and FY19 results announcement mentioning better performance in Q4 of the company due to the better margin.
The stock closed the day’s trade at A$1.845 on 25 Feb 2020. Its 52 weeks high and 52 weeks low stand at A$2.58 and A$1.64, respectively, with a market cap of A$3.71 billion. The earnings per share during the financial year fell by 41% from pcp to 7 cents per share (cps), and the company announced a dividend distribution of ~4.7cps, short by 2% from pcp.
Cooper Energy Limited (ASX: COE) is an ASX-listed O&G company, focusing on discovering resources, as well as developing and commercialising the projects. The critical assets of COE are low-cost oil production from Cooper Basin, Otway Basin and Gippsland Basin.
- Financial Performance
Production remained the same from pcp to 0.66Mmboe in H1 FY20 ended 31 Dec 2019. The sales revenue and underlying EBITDAX went up by 8% and 11% to A$39.1 million and A$16.3 million, respectively. Cash flow from operations witnessed tremendous growth of 3592% from pcp to A$31.4 million. The improvement is due to the increase in other income such as A$9.9 million from liquidated damage, A$1.4 million from the restatement of rehabilitation provisions because of a change in the government bond rate along with the contribution of revenues from gas sales.
Stock Performance
In the last three months, the share price increased by 19.8% from A$0.53 on 4 Dec 2019 to A$0.635 on 19 Dec 2019. The price remained constantly oscillating and then fell to A$0.545 on 29 Jan 2020, and again it oscillated for some time and once again tumbled by ~9.7% from A$0.565 on 20 Feb 2020 to A$0.51 on 24 Feb 2020. The stock closed the day’s trade at A$0.510 on 25 Feb 2020, with a market cap of A$829.59 million.
Its 52 weeks high and 52 weeks low stand at A$0.685 and A$0.455, respectively.
Good Read: Oil Search and Cooper Energy Unveil December Quarter Activities Report
Worley Limited (ASX: WOR) is an Australia-listed consulting and advisory services company. WOR provides a wide range of services, including professional project and asset services, in addition to EPC (engineering, procurement and construction). Worley’s primary focus sectors remain energy, chemicals and resources.
- Financial Performance
For H1 FY20 ended 31 Dec 2019, aggregated revenue, underlying EBITA and NPATA increased by 134%, 126% and 110% from pcp to A$5,998 million, A$366 million and A$216 million, respectively. The underlying operating cash flow witnessed drastic surge from A$21 million to A$277 million.
The Energy and Chemicals Services line of business reported aggregated revenue of A$2,605 million and segment result of $247 million. While the other lines of business that reported revenues during the half-year are Major Projects & Integrated Solutions (aggregated revenue of A$2,432 million), Mining, Minerals & Metals Services (aggregated revenue of A$636 million) and Advisian (aggregated revenue of A$325 million).
Stock Performance
In last three months, the share price increased by 15.7% from A$13.91 on 22 Nov 2019 to A$16.1 on 15 Jan 2020. The price again tumbled by 14% to A$13.85 on 24 Feb 2020. Its 52 weeks high and 52 weeks low stand at A$16.45 and A$11.71, respectively, with a market cap of A$7.21 billion. During H1 FY20, underlying basic EPS went up by 39% from pcp to 41.5 cps and the board approved an interim dividend of 25 cps.
The stock of Worley closed the day’s trade at A$13.610 on 25 Feb 2020.
