


_09_03_2024_01_03_36_873870.jpg)
Crude oil prices are tumbling in the international market as the trade tariff of the United States extended its reach to Mexico and India, post-China.
The Benchmark Crude futures (LCO) plunged significantly from the level of US$70.59 (Dayâs high on 28th May 2019) to the present low of US$60.77 (as on 03rd June 2019 AEST 5:44 PM) over the global economic concerns which put weight on the oil demand in the international market.
In his recent statement, the United States president Donald Trump mentioned that Washington would impose a 5 per cent tariff on Mexico, which would be implemented from 10th June 2019. Mr Trump also warned Mexico that the tariff would be increased gradually if the cross-border issue of illegal migrants from Mexico is not solved.
Post the warning, Mexico decided to instigate a round of talks with the United States for which the president made his intentions clear that Washington wants immediate actions otherwise Mexico would witness a withdrawal of U.S companies and jobs from the country.
Further adding to the global concerns, the United States president terminated the GSP (Generalized System of Preference) of India as Washington was not assured that India would provide âequitable and reasonable accessâ to its market. The termination of the GSP program under which India enjoyed a duty-free status on exports to the United States would be terminated from 5th June 2019.
The current trade dispute of the United States with China concerned the market participants over the growth of global economic conditions and demand of oil, which in turn, exerted pressure on crude oil prices and the prices today marked a gap-down opening. The prices posted highest monthly loss in May and started June 2019 even lower.
Crude Oil on Charts:
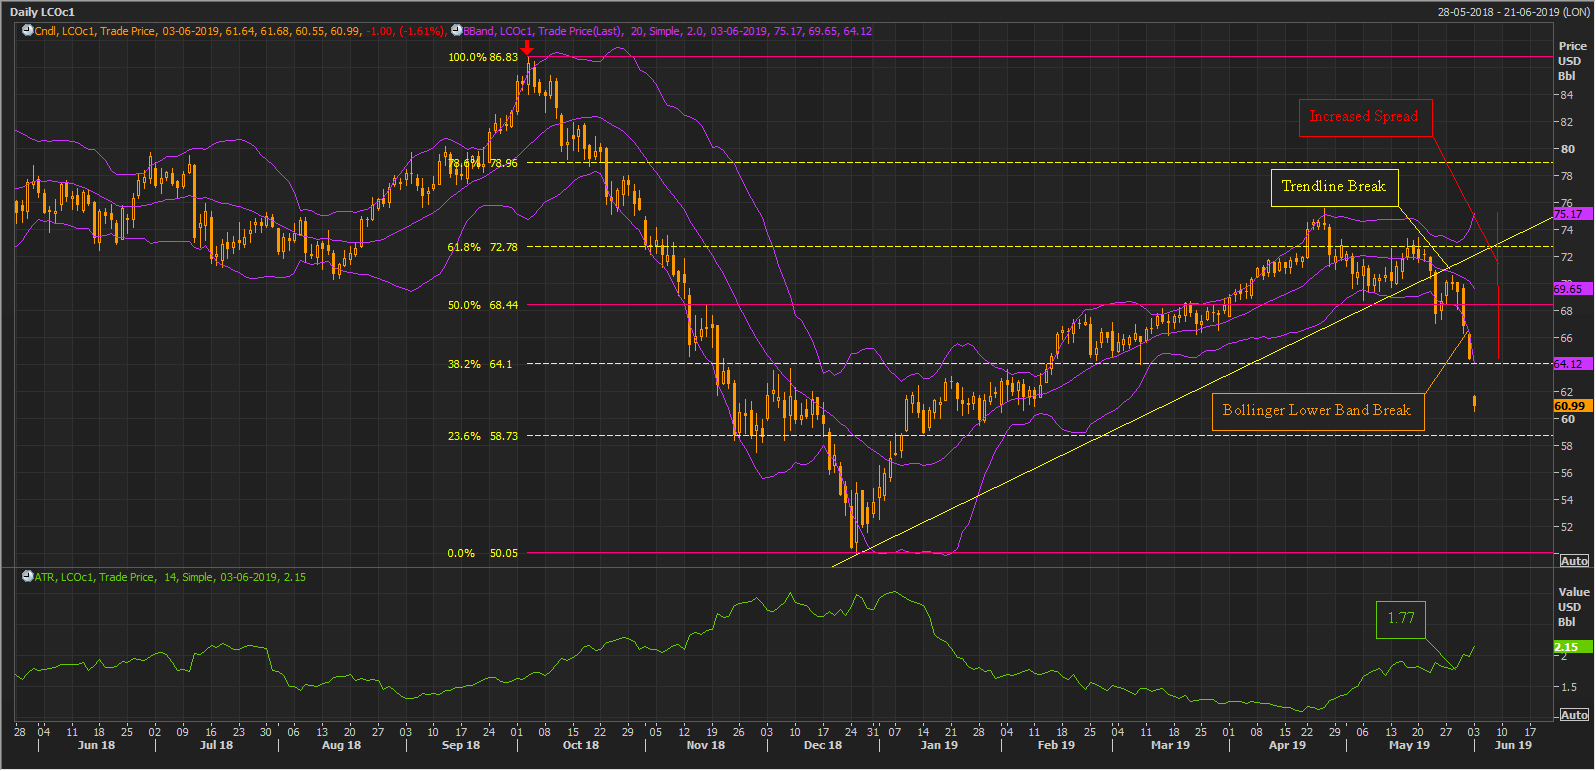 ICE LCOc1 Daily Chart (Source: Thomson Reuters)
On a daily chart, the crude oil prices broke an upward sloping trendline (yellow line) recently and fell to the present level of US$60.99. Upon carefully observing the daily chart, we can see that the prices previously moved in a downtrend from the level of US$86.74 (red downside arrow) to the level of approx. US$50.05.
However, the prices rebounded back by more than 61.8 per cent before currently resuming its prior downtrend. Apart from the breakdown of a trendline, the prices also jolted below the lower band of the Bollinger band with a median of 20-days simple moving average.
With such a sudden break below the lower band, the prices marked a wide gap between the upper and lower band of the Bollinger, which in turn, denotes the high volatility in the price moment of the commodity.
The high volatility is also confirmed by a rise in Average True Range from 1.77 (as on 28th May) to the current level of 2.15.
In the recent scenario, on an hourly chart, the prices dropped and made a new low and rebounded back, which, in turn, provides optimum points to connect the Fibonacci Series.
 ICE LCOc1 Hourly Chart (Source: Thomson Reuters)
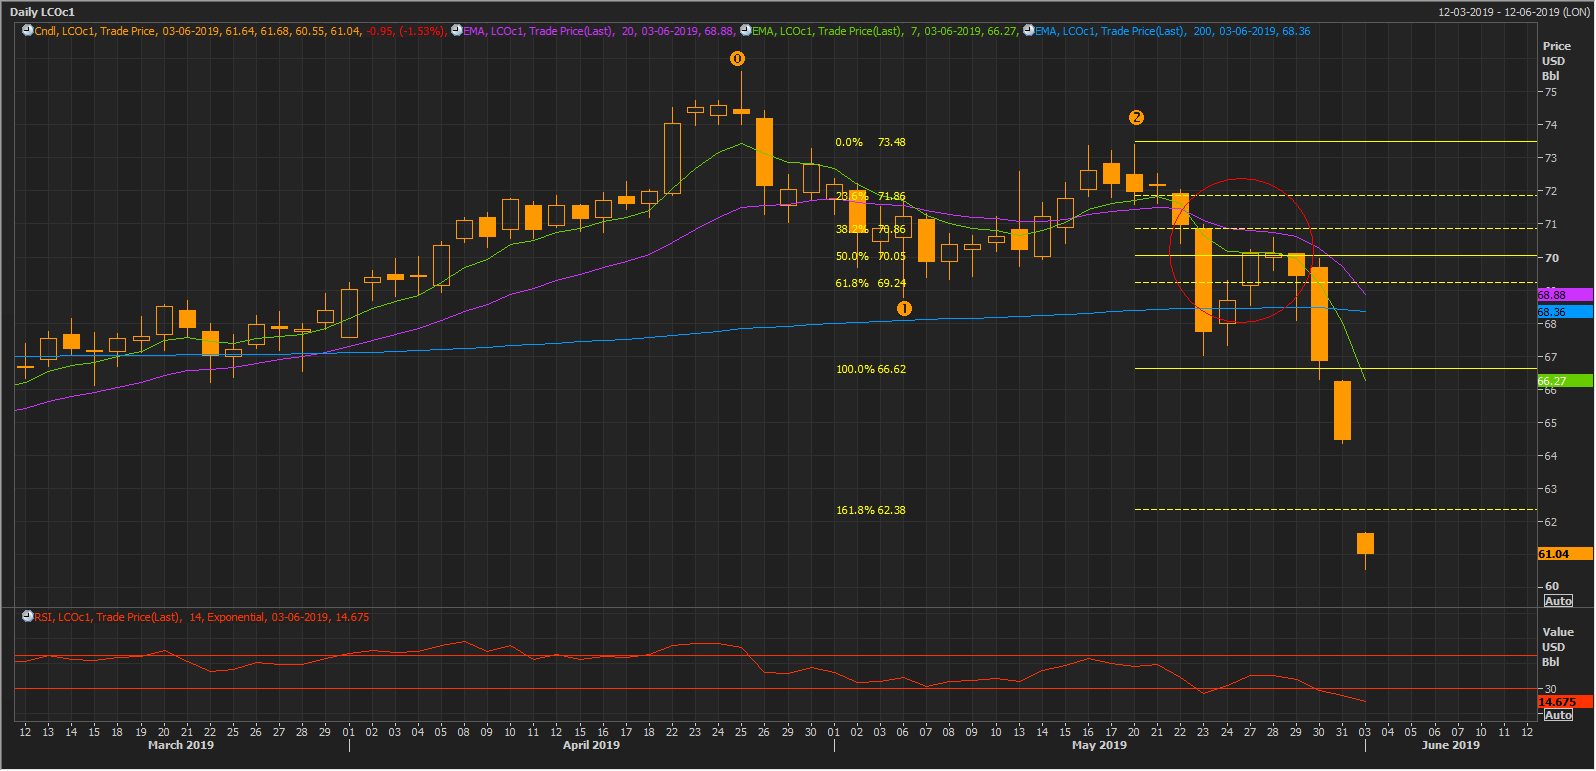
The three points are marked as 0,1,2 for which we connected the Fibonacci, the results of the Fibonacci Projections are as:
23.6% (US$71.86), 38.2% (US$70.86), 50.0% (US$70.05), 61.8% (US$69.24), 100.0% (US$66.62), 161.8% (US$62.38). The hourly chart is also marking a death cross of short-term 7 and 20-days exponential moving average, which is shown on the above chart by a red contour.
Disclaimer
This website is a service of Kalkine Media Pty. Ltd. A.C.N. 629 651 672. The website has been prepared for informational purposes only and is not intended to be used as a complete source of information on any particular company. Kalkine Media does not in any way endorse or recommend individuals, products or services that may be discussed on this site. Our publications are NOT a solicitation or recommendation to buy, sell or hold. We are neither licensed nor qualified to provide investment advice.
