

Industrial metals and crude oil prices are lumbering as trade tussle intensifies between the United States and China.
The United States President Donald Trump again took over twitter to express his opinion over the trade relation with China. In a recent tweet, the President alleged that for many years, China took the advantage and stole the intellectual property of the United States, due to which the country lost hundreds of billions.
The United States President further fanned the tensions between the two significant economies of the globe, and in his tweet, the President suggested that the trade relationship with China is unfair and China should not have put a tariff on 75 billion worth of United States products.
Mr Trump further took a shot at China and announced the previously decided tariff hike, around US$250 billion worth of Chinese goods would now be facing a tariff of 30 per cent from 1 September 2019, which is currently taxed at 25 per cent.
The United States President further introduced another round of fresh tariffs on the remaining US$300 billion worth of Chinese goods. The US$300 billion worth of Chinese goods would now be taxed at 15 per cent, which was previously taxed at 10 per cent, effective from 1 September 2019.
The base metal and crude oil market were quick to react over Washingtonâs action, and the price of risky commodities plunged in the international market.
However, the recent event propelled the gold price again above the US$1,500, and the gold price is currently holding the upper levels.
On the other hand, post a slight recovery from A$58.24 (Dayâs low on 26 August 2019) to the level of US$60.47 (Dayâs high on 28 August 2019), crude oil price has again taken a hit today. The crude oil is currently trading at US$59.59 (12:40 PM AEST).
Crude oil price previously felt the pressure of high domestic production along with higher exports and lower imports in the United States.
Over the drastic fall in crude oil price, the energy players on ASX have lost a significant market value from the beginning of August.
What to Expect from the Crude Oil Ahead?
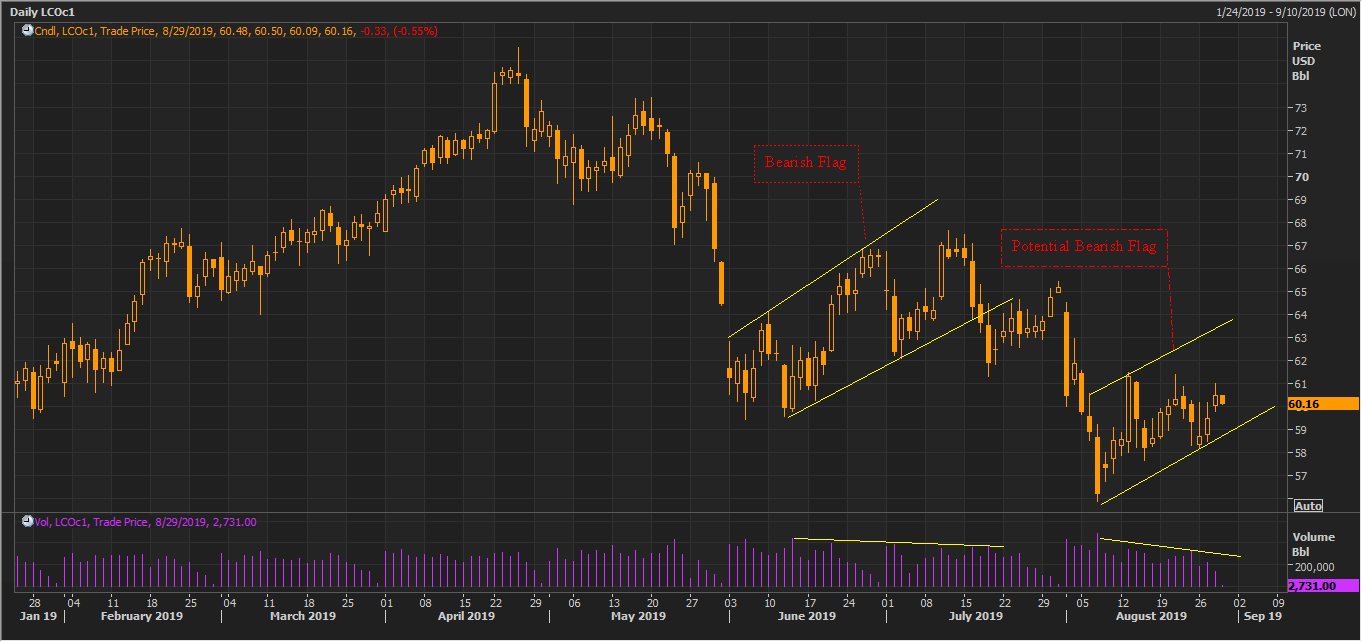
LCO Daily Chart (Source: Thomson Reuters)
On the daily chart, the crude oil price recently witnessed the formation of a bearish flag pattern, and the consequently crude oil dropped in the international market. Post the unfolding of the bearish flag the crude oil price rose witnessed a pullback rally and price dropped again after taking resistance at the lower end of the previously formed bearish flag.
In the Status quo, the price is again forming a similar pattern, which is currently a potential bearish flag, if the price now rise to test the upper band of the potential bearish flag and fail to cross it with good volumes, that would confirm the formation of a bearish flag again on the daily chart.
Both the bearish and the potential bearish flags have witnessed similar volume patterns with declining volume, which denotes the weakness of the bulls at the upper levels.
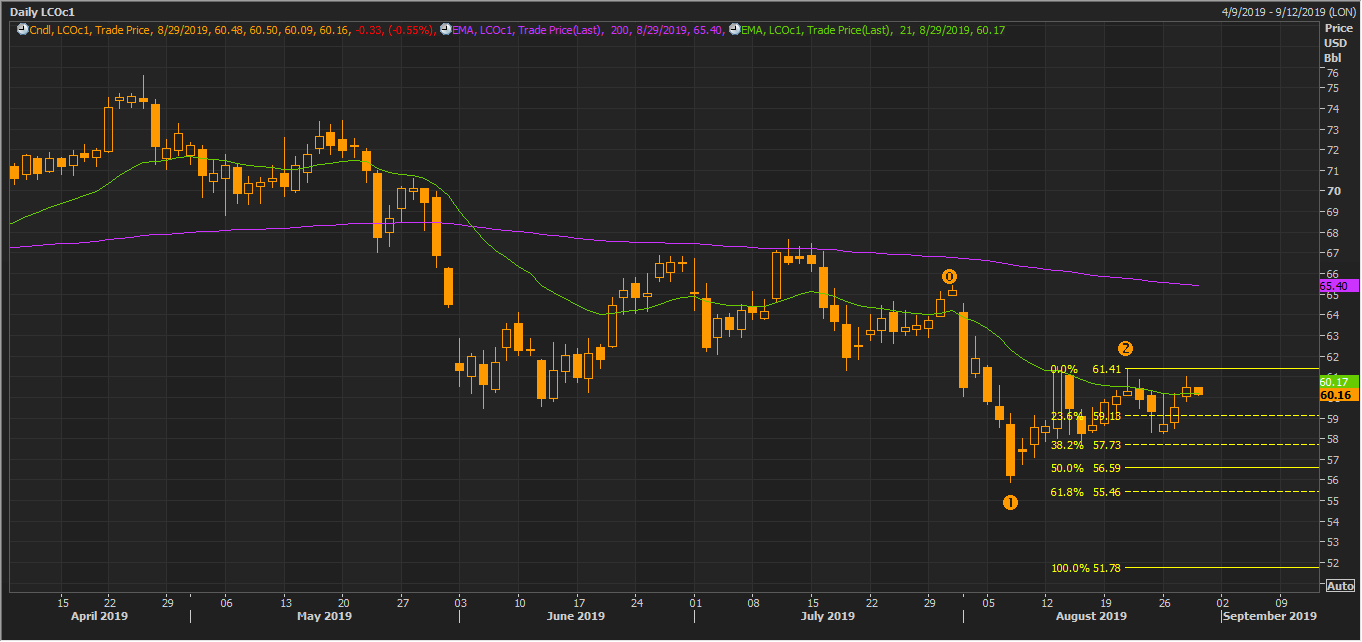
LCO Daily Chart (Source: Thomson Reuters)
On investigating the daily chart further, we can see that the crude oil price is showing a downside wave movement, which could be further be checked by the Fibonacci Projections. Upon projecting the Fibonacci from the levels 0,1,2, we can see that the price has currently taken a support around 38.2 per cent projected level, which is at U$57.73.
The US$57.73 could act as immediate support for the price, and investors should monitor this level. On the upper end, the price could face the dual hurdle of US$61.41 and the upper line of the potential bearish flag.
Safe-Haven:
The safe havens remained in demand in the market as the global uncertainties prevailed in the market over the United States President Trumpâs tweet. The strong fundamentals of gold also fanned the higher movement.
Also Read: Safe Havens Back in Demand, Look at 10 ASX Gold Stocks
What to Expect from Gold Ahead?
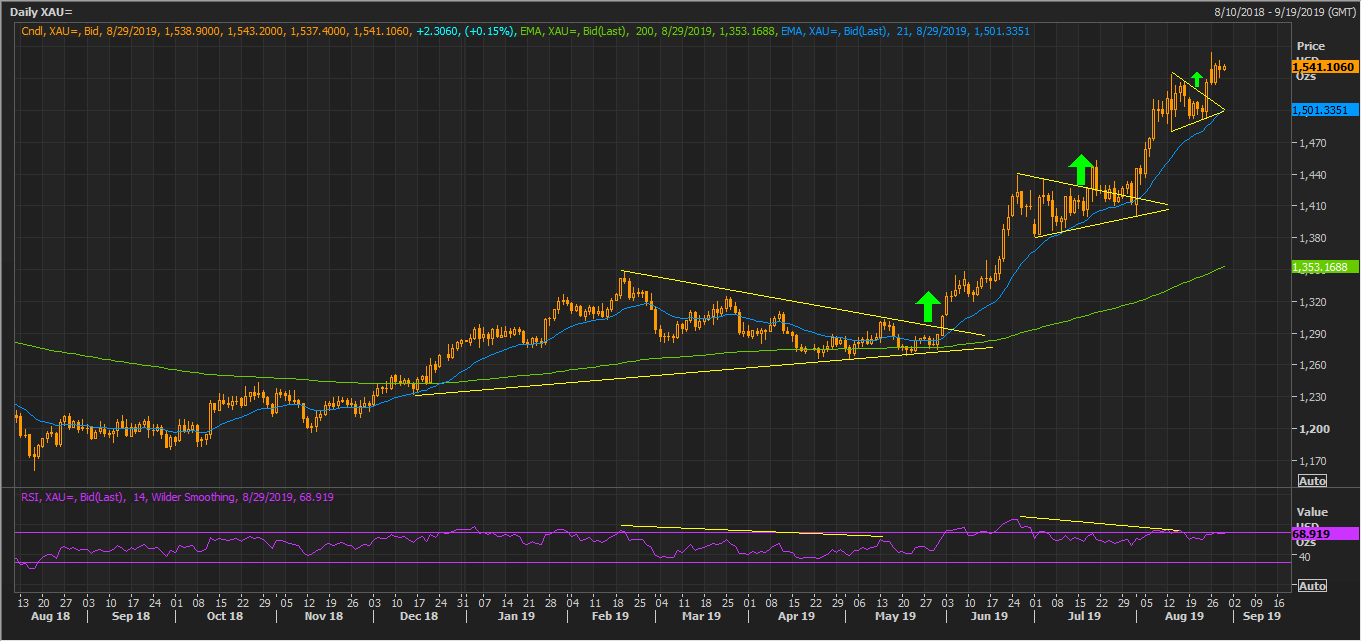
XAUAUD Daily Chart (Source: Thomson Reuters)
On the daily chart, the Australian dollar-denominated gold price has given a fresh breakout of the symmetrical triangle to establish a new record high of A$2,322.18 (Dayâs high on 26 August 2019), and the price is currently holding the upper levels.
The price either can could move down to retest the breakout level, and investors should monitor the retest level as a breakout post a retest indicates bullish sentiments. The XAUAUD price is currently trading above the 21- and 200-days EMA, which are at A$1501.3351 and A$1353.1688, respectively.
Gold Price has repeated a similar pattern in the past, and this is the third time, the Australian dollar-denominated gold spot is witnessing the breakout of a similar triangle pattern. Likewise, the 14-day Relative Strength Index has witnessed the same downtrend during the breakout.
Presently, the 14-day RSI is in the overbought zone, which could lead to a short-term price correction. Also, the 21- and 200-days EMA have shown a promising cross, after the 21-days EMA crossed the 200-days EMA from below.
If the gold price moves to retest the breakout level, the primary support remain at the upper end of the symmetrical triangle; while the secondary support should be provided by the 21-days EMA. Investors should monitor the above-mentioned level closely to reckon the future price movement.
Also Read: Gold Rush Led The ASX-listed Gold Miner Shine; A Glimpse Over 10 Gold Stocks
XAUAUD Daily Chart (Source: Thomson Reuters)
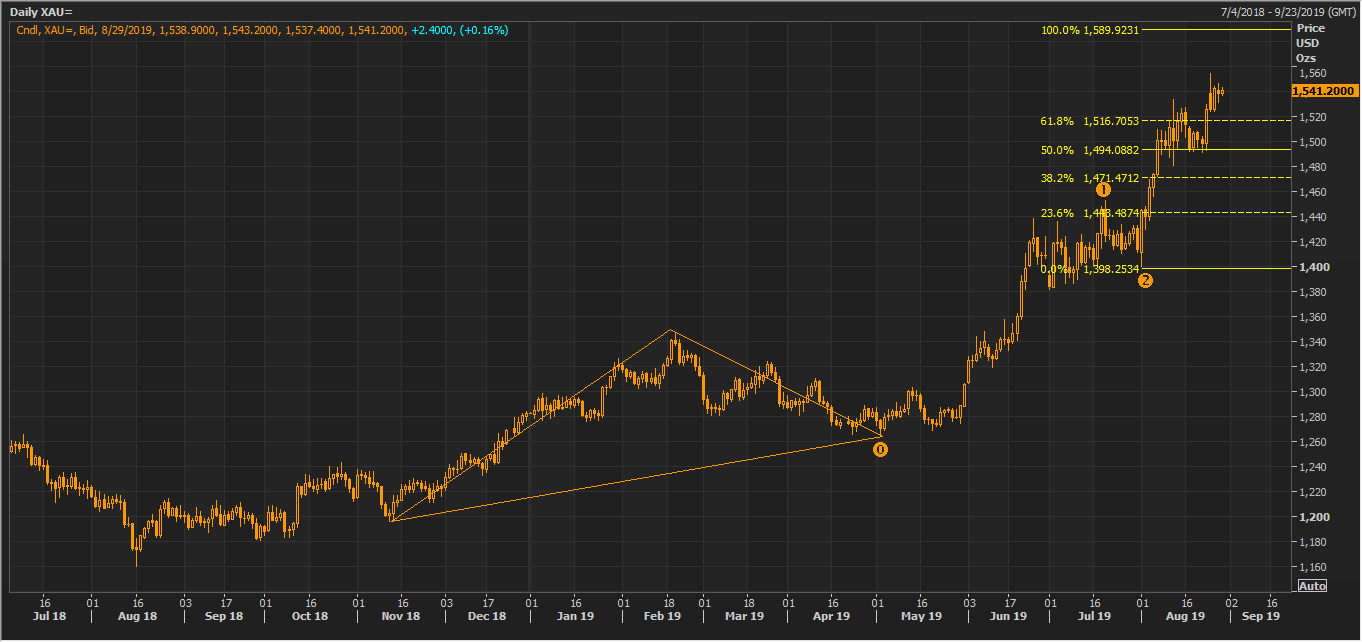
On the daily chart, the gold price has crossed the hurdle of 61.8 per cent Fibonacci series, and the projected level would remain intact until the price breaches the low of the candle marked as 2 on the daily chart.

XAUAUD Daily Chart (Source: Thomson Reuters)
The gold price has witnessed similar wave motions and the price has breached the 161.8 per cent of the projected level previously.
The overbought RSI indication might lead towards a profit booking; however, the past movement in RSI suggests a strong bull rally post a correction and retest of the breakout levels.
Disclaimer This website is a service of Kalkine Media Pty. Ltd. A.C.N. 629 651 672. The website has been prepared for informational purposes only and is not intended to be used as a complete source of information on any particular company. Kalkine Media does not in any way endorse or recommend individuals, products or services that may be discussed on this site. Our publications are NOT a solicitation or recommendation to buy, sell or hold. We are neither licensed nor qualified to provide investment advice.
