


Risky commodities have plunged in the global market over the global trade tension, while on the other hand, risk-free assets such as the precious metals, Japanese Yen, and the bonds have impressed the global investors over the past two months.
Risky Assets:
Risky assets such as base metals, Currency, etc., have plunged significantly over the slowdown in the significant global economies such as China. China being the primary consumer of the base metals, sets the price actions of the base metals, and recently, China noticed an average annual decrease in industrial production.
The industrial production inched up by 5.0 per cent in May 2019 (year-on-year) as compared to the market expectation of 5.4 per cent, the rise of 5.0 per cent pinned the weakest expansion in the industrial sector since 2002.
The decline in the industrial production represented a decelerated growth for other sectors such as electricity sector, heating power, gas and water sector. Apart from the decrease in industrial production, China also witnessed a slight decline in the manufacturing industry as well.
As per the data, the Manufacturing PMI in China for May 2019 stood at 49.4, well below the threshold level of 50, and below the market expectation of 49.9 as well. However, the Caixin Manufacturing PMI for May 2019 remained unchanged as compared to the previous month and stood at 50.2, up from the mean value of 50.0.
The weaker industrial production coupled with a slight slowdown in the manufacturing sector exerted pressure on the base metal prices.
The United States slightly contributed to the plunge of risky assets. The ISM Manufacturing Index dropped to the level to 52.1 in May from the level of 52.8 in April; however, the value of the index remained above the mean value of 50, but it went below the market expectation of 53.0.
Currency Market:
The progressive slowdown in the economic conditions along with other factors devalued most of the global currencies again the dollar.
CNY/USD:
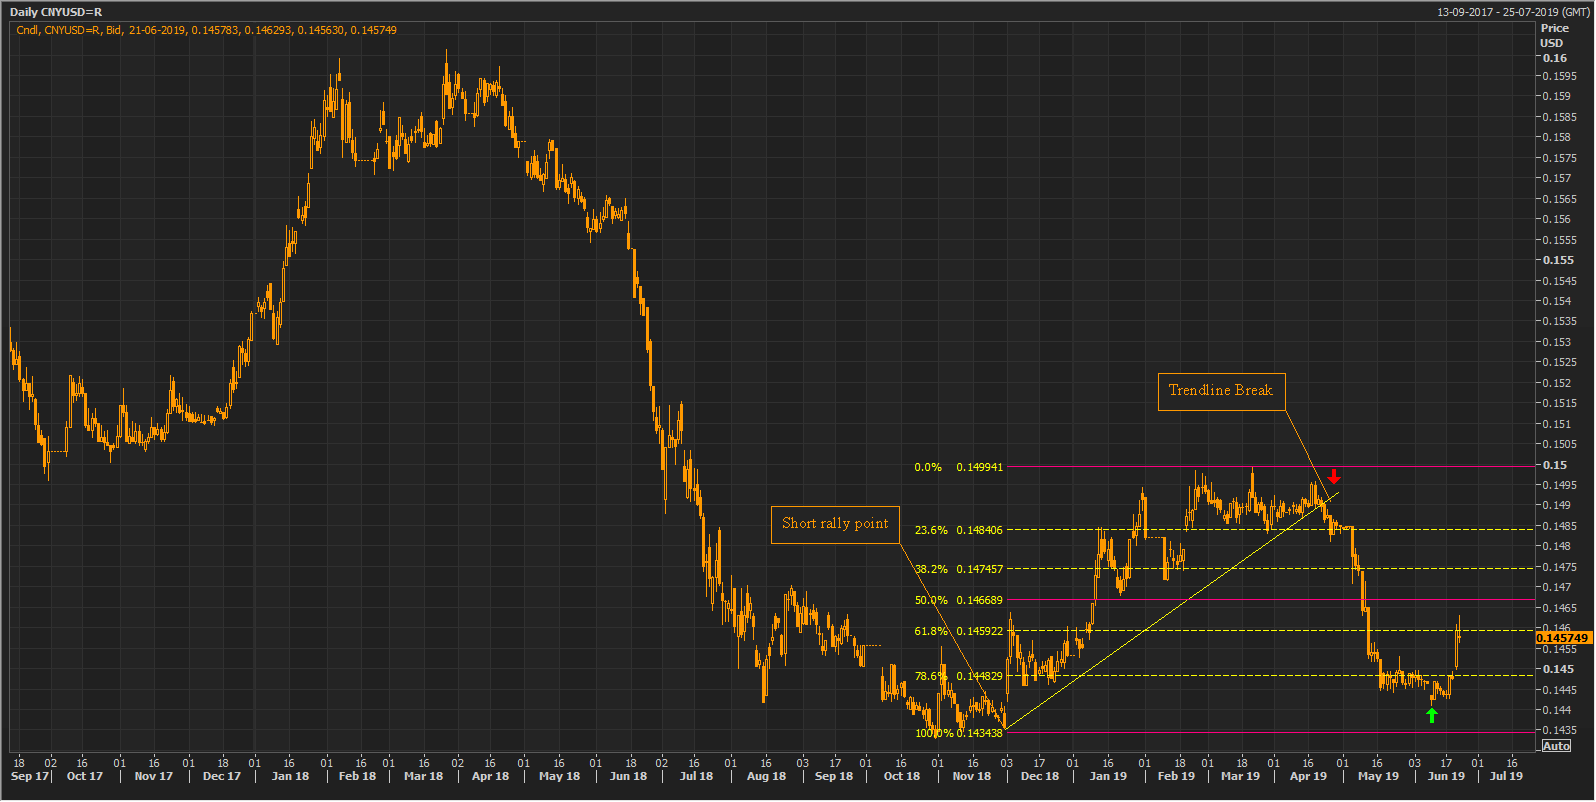
CNYUSD Daily Chart (Source: Thomson Reuters)
CNY prices rose slightly from the level of approx. US$0.143438 in December 2018 to the level of US$0.149941 in March 2019. However, the prices quickly depreciated over the substantial gain in the dollar prices and retraced by more than 78.6 per cent of the initial short rally. Post the uprise from the level of US$0.143438 to US$0.149941, the currency broke the upward sloping yellow trendline and fell.
What to Expect Further?
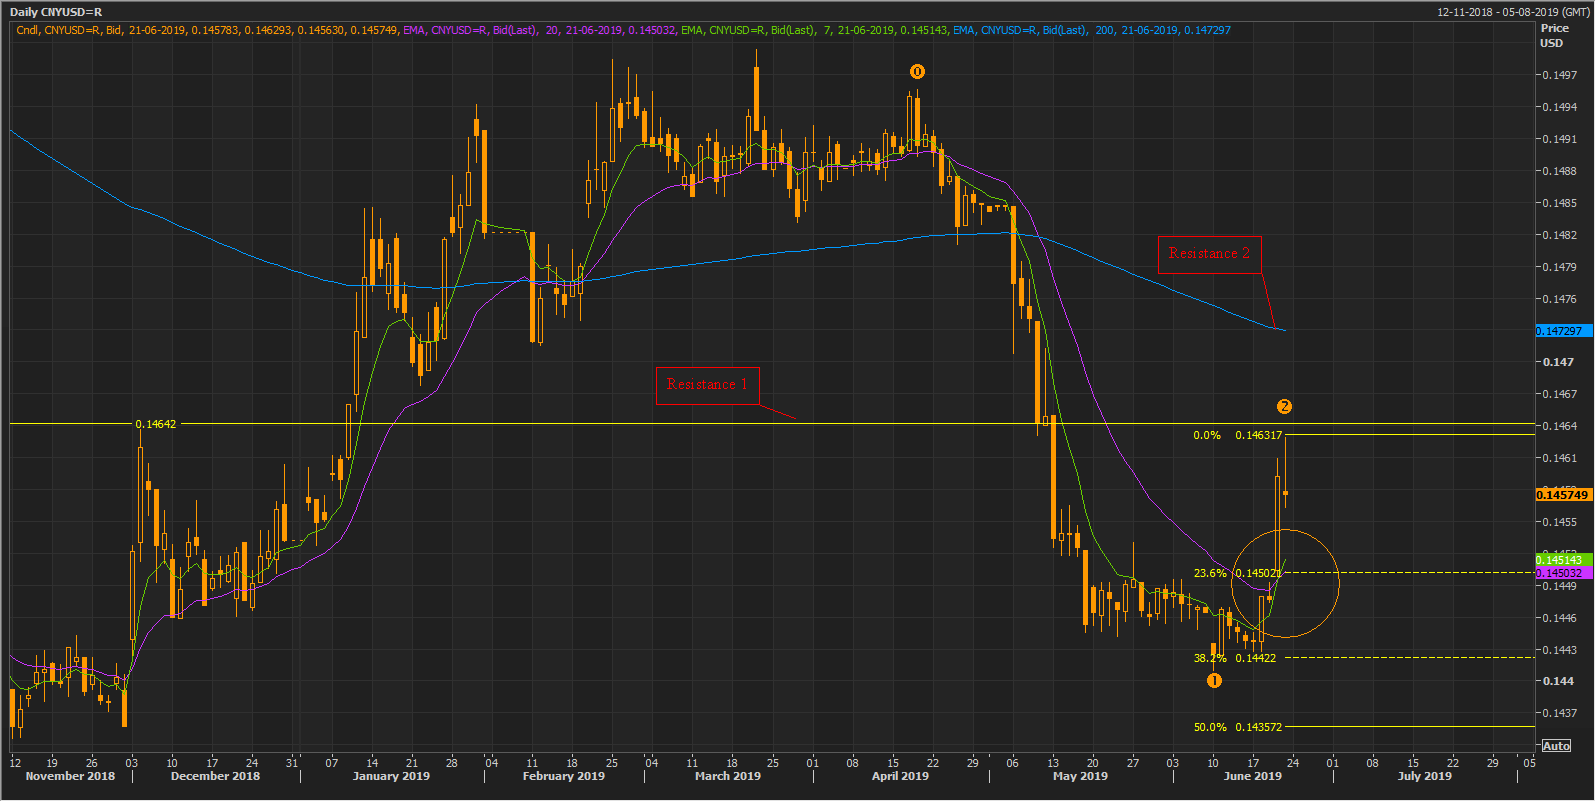
CNYUSD Daily Chart (Source: Thomson Reuters)
On analysing the daily chart further, we can see that the currency price is currently taking the resistance of US$0.14642. The prices are currently trading below its 200-day exponential moving average, which is at US$0.147297. However, on a daily chart, the price actions have shown a Golden Cross (bullish signal) of 7 and 20-days exponential moving averages, which are currently at US$0.145143 and US$0.145032 respectively. The golden cross is marked with an orange circle on the chart shown above.
The price drop from the level of US$0.149941 coupled with the uprise gave excellent coordinates to connect the downside Fibonacci Projections (0,1,2), and the prices are currently taking the support of 38.2 per cent level of the Fibonacci Series, which is at US$0.14422.
The investors should keep a close eye on the level of US$0.14642, as break-above or failure to do so would decide further action in it.
DXY:
Contrarian to the CNY the dollar index rose significantly until recently, as FED ignored the United States president demand of slashing the interest rate; however, in the status quo, the FED is adopting more dovish stance, which exerted pressure in the dollar prices, the FED intends to keep the interest rate in the target of 2.25 per cent to 2.50 per cent for the year; however it further gave a hint towards a decline.
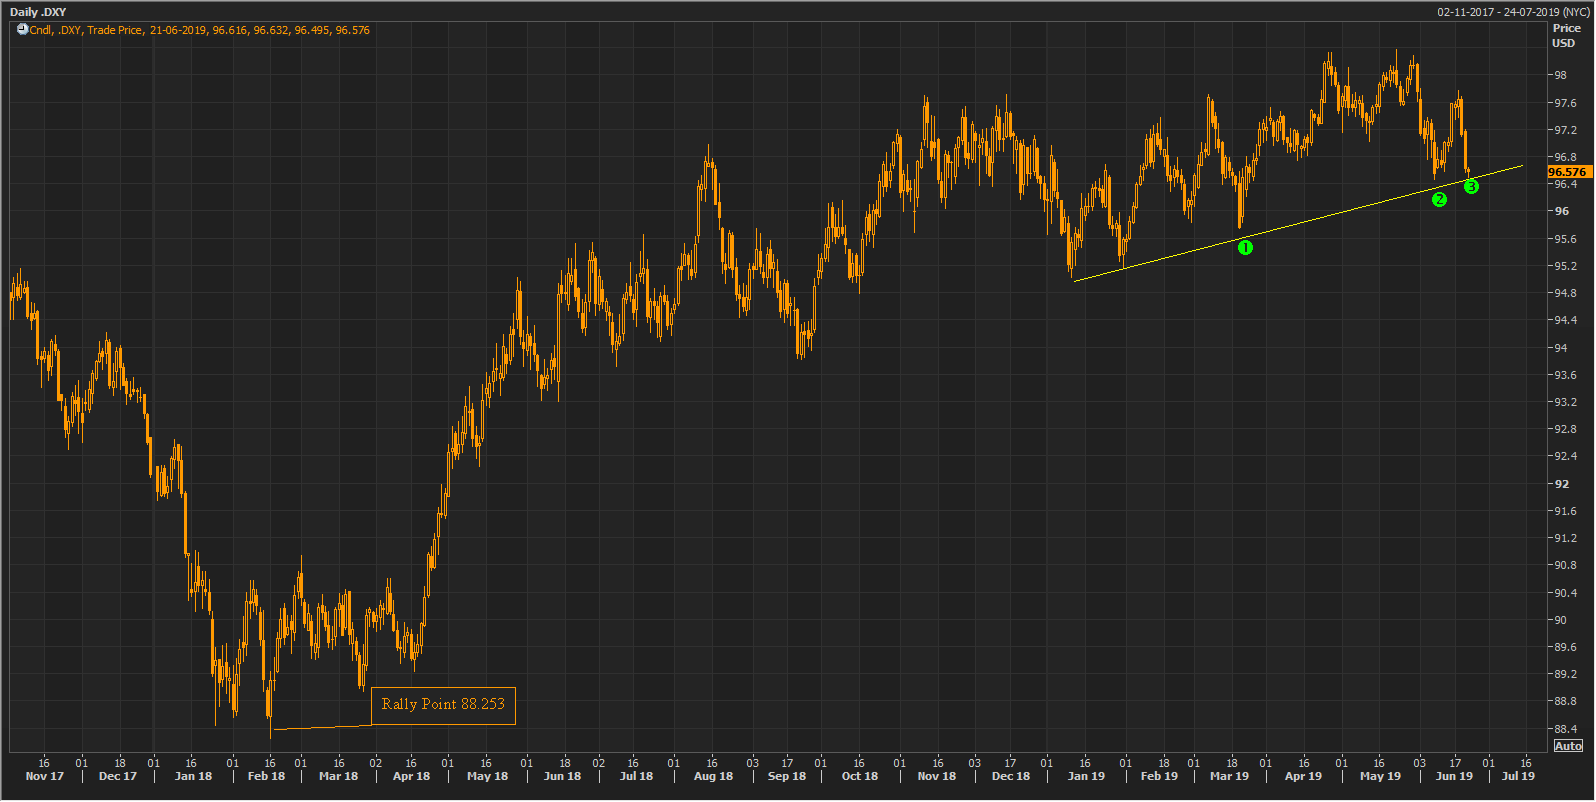
DXY Daily Chart (Source: Thomson Reuters)
The Dollar Index rallied from the level of 88.253 and reached the high level in May 2019, which in turn, devalued the global currency pairs, especially the Chinese RMB, the depreciated currency along with the deteriorating domestic conditions in China exerted pressure on other commodities such as the base metals and oil.
What to Expect Further?
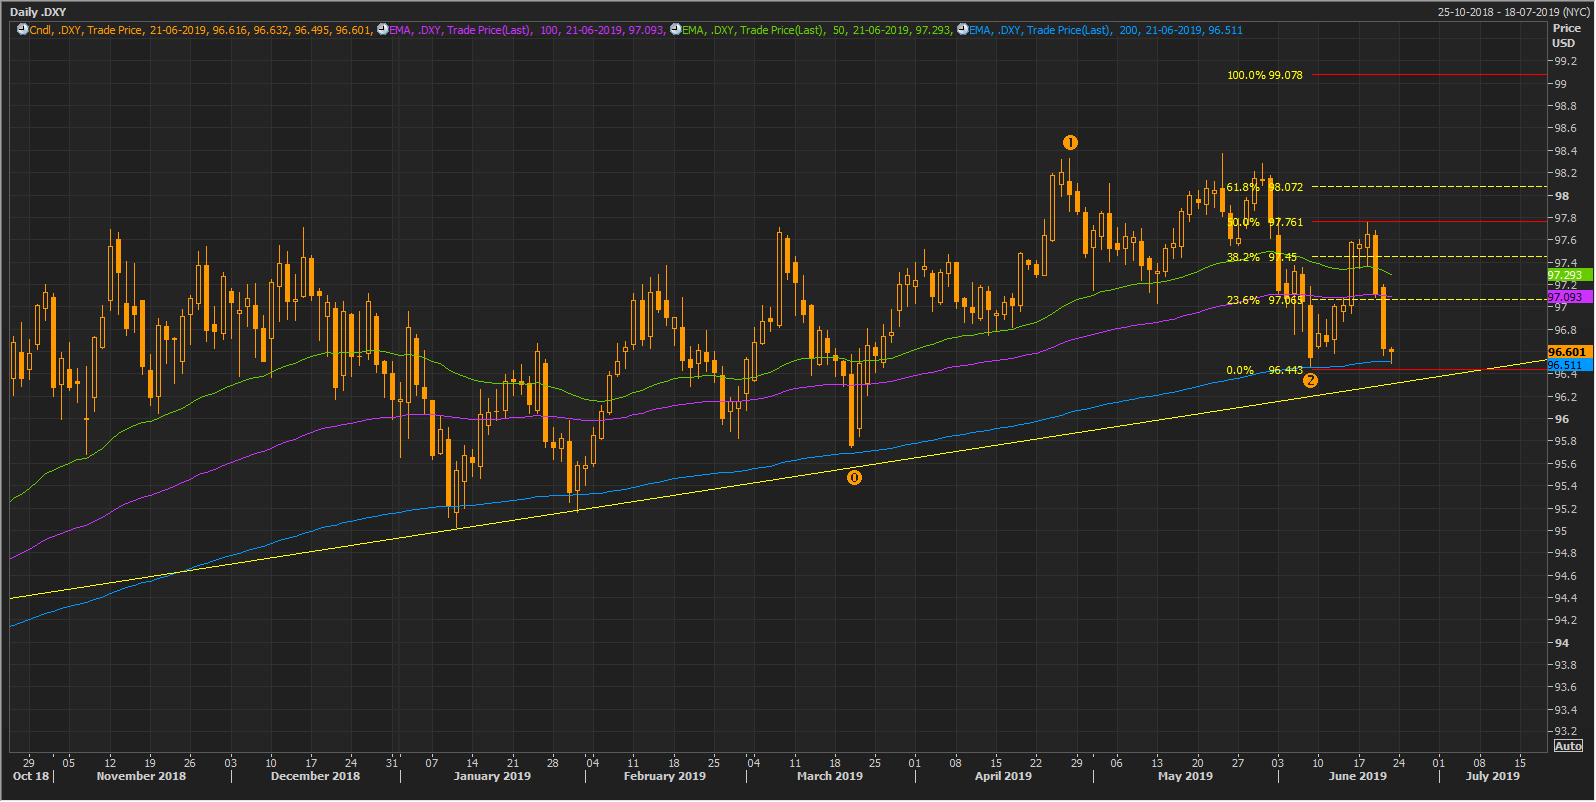
DXY Daily Chart (Source: Thomson Reuters)
The Dollar Index prices are currently taking the support from the upward sloping yellow trendline and the 200-days exponential moving average. The Fibonacci Projection points (0,1,2) revealed the level of 97.761 (50.0 per cent), where the prices are taking its initial hurdle.
The investors should keep a close eye on both the levels as a breakout from either level would decide further action in it.
On the currency counter, we saw that the Chinese currency depreciated, which in turn exerted pressure on risky commodities prices.
Base-metals:
LME Nickel:
The prices of the metal CFD dropped from the level of US$13757.50 (High in March 2019) to the level of US$11607.50 (Dayâs low on 7th June 2019), which in turn translates to a fall of more than 15 per cent in the tenure of three months.
Most of the base metals followed the same trend and plunged, which now makes them attractive; however, many investors are conducting due diligence to find the right spot to enter the market; however, the prices are currently volatile.
To address the concern, let us have a look over the basics of the commodities.
Nickel:
The nickel forward-pricing curve on the London Metal Exchange is sloping upwards with a small gap of bid and offer, which, in turn, suggests that the market is currently well supplied.
However, the Brazilian miner- Vale recently announced that the company is suspending the operations of its nickel processing at Onca Puma Plant, and the investors should keep a close eye over the counter to reckon the demand and supply dynamics.
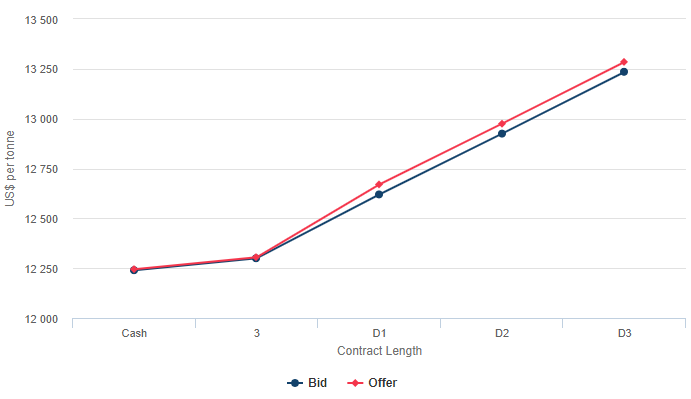
Nickel Forward Curve (Source: LME)
LME Zinc:
The forward pricing graph of zinc is currently sloping downwards, which in turn, signifies that as per the current scenario, the zinc market is well supplied with low demand.
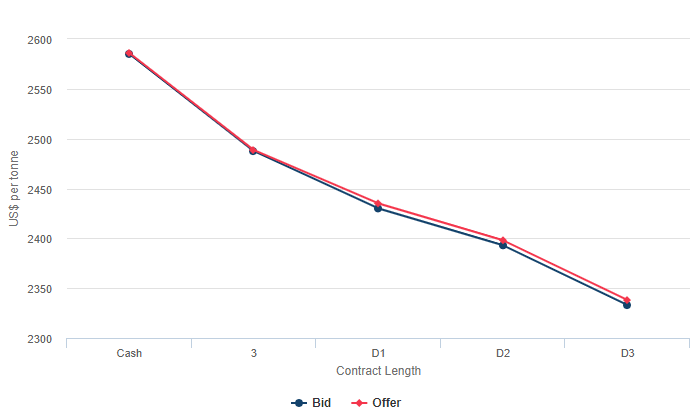
Zinc Forward Curve (Source: LME)
Likewise, the investors should check the forward pricing curve of other base metals as well to gauge the demand and supply dynamics.
Post addressing the base metal market, let us now take a look over the oil market.
Over the global economic slowdown concern, the oil prices have seen a significant blow from its 2019 high. The Brent Oil spot plunged from the level of US$75.72 (high in April 2019) to the present low of US$60.28 (Dayâs low on 12th June 2019).
The prices are noticing a surge from the past few trading sessions; however, the investors should take care as the prices are mainly event-driven. The ongoing tension in the middle east and constant attacks on the oil tankers are pulling the prices up.
To further reckon to market trend, the investors should keep a close eye over the middle east development.
Crude Oil on Charts:
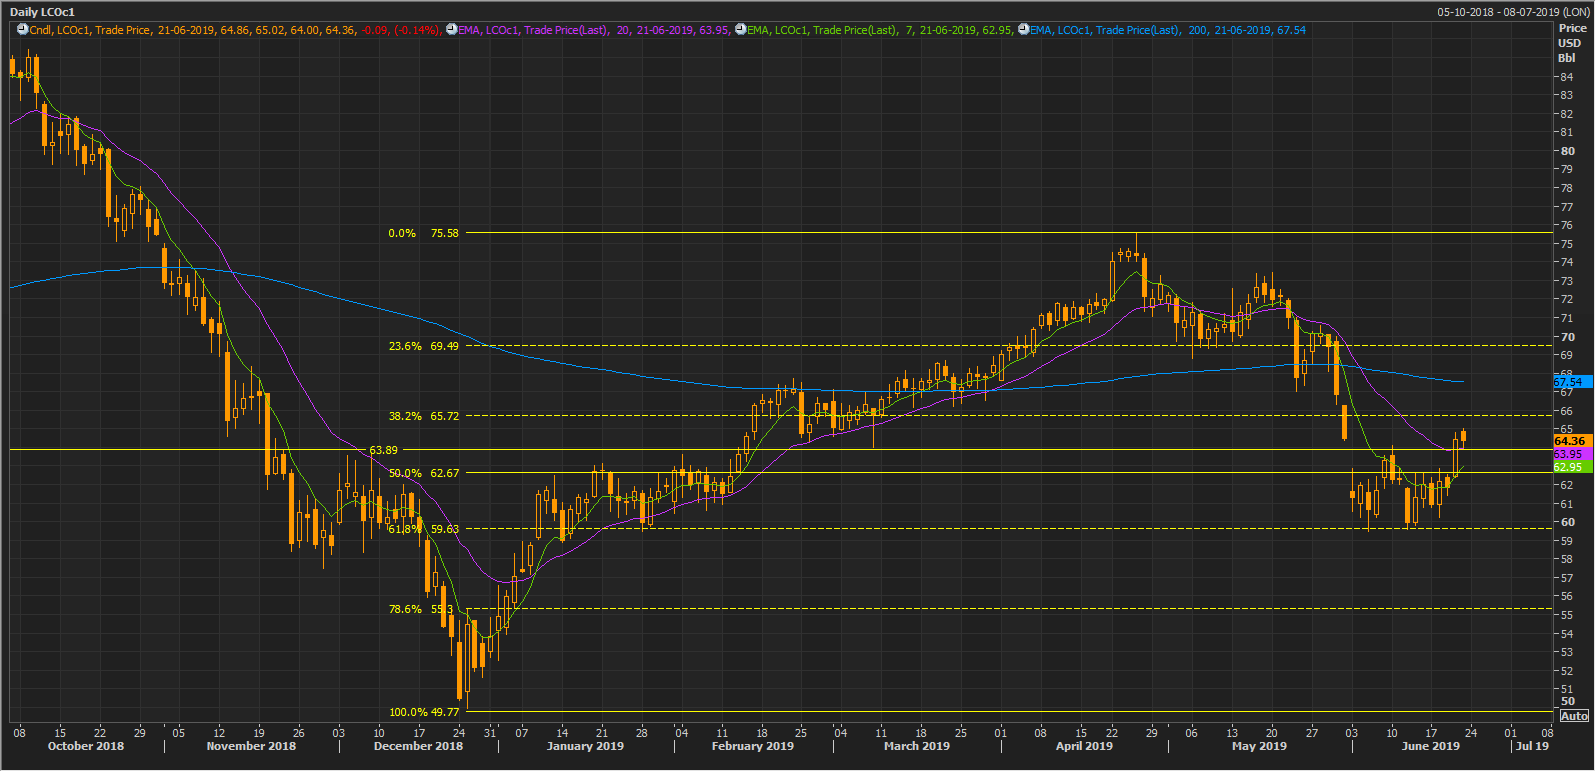
LCO Daily Chart (Source: Thomson Reuters)
On following the chart above, we can see that the crude oil prices started a short rally from the level of approx. US$49.77 to the level of US$75.58, which acted as the high of LCO in the year 2019. Post hitting the level of US$75.58, the crude oil prices retracted to the level of US$59.63 or by 61.8 per cent of the original rally.
The prices are currently trading below the 200-days exponential moving average; however, the prices are taking the support of the 20-days exponential moving average. The previous resistance of US$63.89, is now acting as support for the prices, and the investors should keep a close eye on the level as a break below or sustain above would decide further price action.
In a nutshell, most of the commodities have lost value in the past two months and are now trading around crucial levels. However, the prices are getting pulled by events rather than the demand and supply dynamics, and investors should remain cautious over the development.
Disclaimer
This website is a service of Kalkine Media Pty. Ltd. A.C.N. 629 651 672. The website has been prepared for informational purposes only and is not intended to be used as a complete source of information on any particular company. Kalkine Media does not in any way endorse or recommend individuals, products or services that may be discussed on this site. Our publications are NOT a solicitation or recommendation to buy, sell or hold. We are neither licensed nor qualified to provide investment advice.
