


Iron ore prices are in doldrums again over the fall in demand and gradually increasing port stocks in China, the largest consumer of the Australian iron ore supply chain. The industry experts and market participants anticipate the iron ore prices to tumble gradually, which turns all eyes to the number one iron ore supplier to China- ASX-listed iron ore miners.
Iron ore Price Scenario
Iron ore prices rose slightly amid the restocking by the Chinese mills ahead of the national holidays in China, which in turn, propelled the prices to the level of RMB 667.50 (Dayâs high on 8 October 2019) from the level of RMB 619.00 (Dayâs low on 25 September 2019).
However, the prices again tumbled across the Dalian Commodity Exchange to the level of RMB 633.50 (Dayâs low on 10 October 2019) over the increase in supply.
Also Read: Steel And Iron Ore Miners Under Radar Post Chinaâs Golden Holidays
Strengthening Supply
Iron ore inventory across the significant Chinese ports is gradually increasing, and recently, the inventories across the 35 significant Chinese ports reached the level of 116.64 million metric tonnes (as on 11 October 2019), which in turn, underpinned the growth of over 5.30 per cent against the previous corresponding weak.
The iron ore inventory increased by 5.94 million metric tonnes; however, the inventories across the 35 significant Chinese ports remained down 15.41 million metric tonnes against the same period in 2018.
However, the lifted smog alerts in central and eastern regions of China, including the top steelmaking provinces-Tangshan supported the delivery of iron ore from the 35 major ports in China during the period of 5 October 2019 to 11 October 2019.
- The delivery from the 35 major Chinese ports averaged 2.82 million metric tonnes for the same period, which was 364,000 metric tonnes higher against the week ended 27 September 2019 and was 149,000 metric tonnes higher from the same period in 2018.
- Despite a slight increase in the deliveries from the ports, the market participants remained cautious about rising the quotes substantially amid gloomy demand and fear of further production cuts in China amid stringent environmental regulations.
Environmental Supervisions in North China
One of the top steelmaking provinces in North China- Hebei is all set to face a fresh round of environmental supervisions.
- As per the local media sources, the Inspectors from the provincial environmental bureau would keep few cities in China under lens from October to November 2019.
- Apart from that, a month-long probe would commence in Shijiazhuang, Xingtai and Handan from 15 November 2019.
- The Anhui provinces, which includes Huaibei, Bengbu, Fuyang, etc., would also inspect environmental conditions.
Iron ore on Charts
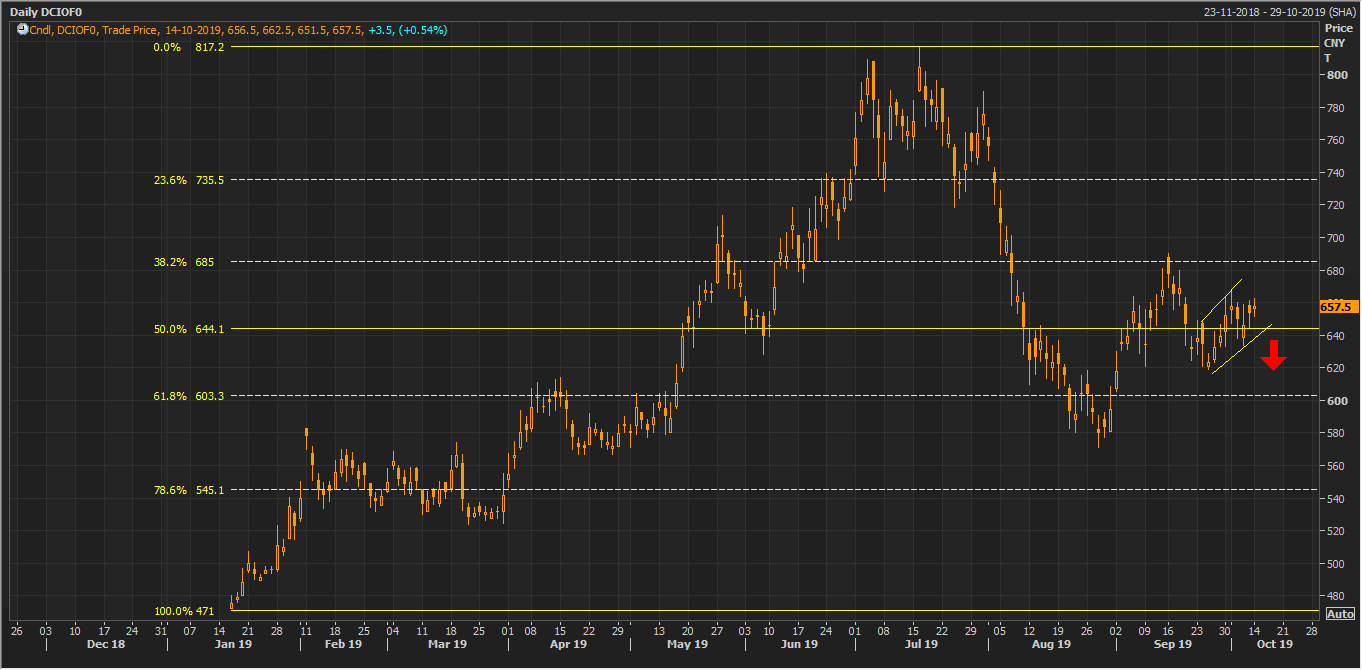
DCIOFO Daily Chart (Source: Thomson Reuters)
On the daily chart, the iron ore prices are consolidating in a narrow channel, which is resembling the bearish flag pattern; however, could not be confirmed as no of consolidation days are larger than the number of days it took for the prices to fall.
On applying the Fibonacci retracement, we can observe that the prices fell below the 61.8 per cent of the initial rally which started from the level of approx. RMB 471.00 to the level of RMB 817.20. The fall of more than 61.8 per cent of the initial rally instigated buyersâ interest, and the prices rose again in the market to reach above RMB 685.00; however, the bears soon took charge, and the prices fell again across the Dalian Commodity Exchange.
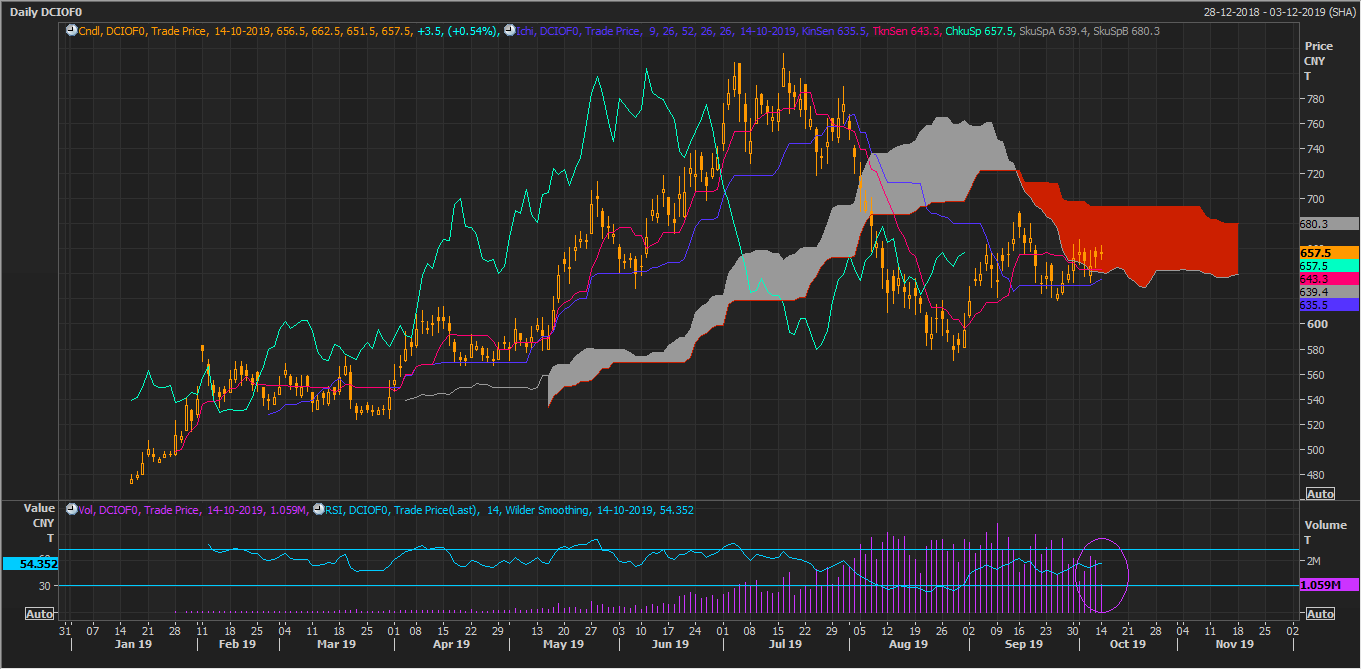
DCIOFO Daily Chart (Source: Thomson Reuters)
After applying the Ichimoku technique, we can notice that the prices are trading between Span A and Span B of the Ichimoku. Span A, which is the mean of the conversion line and the base line is at RMB 639.40 and Span B, which is the mean of the 52-period high and low is at RMB 680.30. Span A is the major hurdle for the prices.
It could be deciphered from the Ichimoku chart analysis that, the prices can rise to test the Span B as the conversion line, which is the mean of the 9-period high and low is crossing the base line- the mean of 26-period high and low from below; however, the crossover is still doubtful as it took place below the Span A.
The 14-day Relative Strength Index is supporting the bullish stance as the value is above the mean of 50 (is at 54.352) and is rising upwards.
However, one major problem, which the bulls could face is the fall in volume i.e., post falling with heavy volumes, the recovery in prices of iron ore is not followed by heavy volume, which could be either associated to the weak speculative buying or the profit booking from the sellers.
To further investigate, it would be necessary to analyse the future, or the forward curve of the iron ore contracts.
Future Curve Analysis
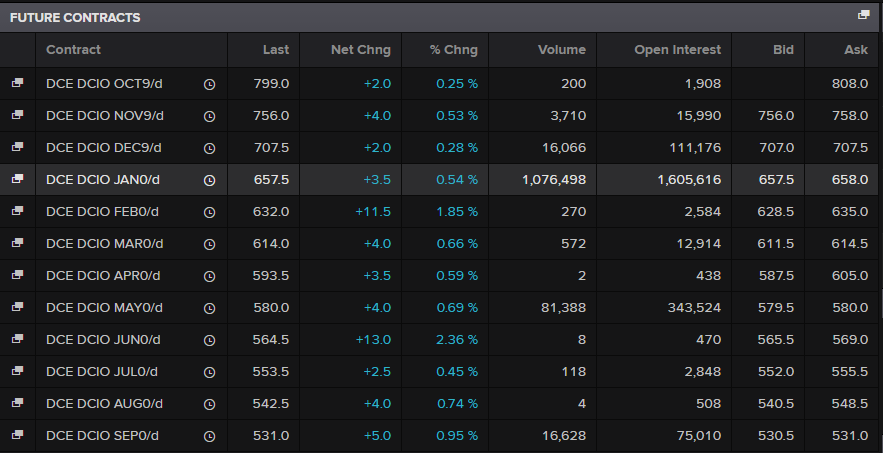
DCE Iron Ore Future Quotes (Source: Thomson Reuters)
It can be seen from the quote table shown above, that the October 2019 series is in contango from the current series, with 1,908 open interest (i.e. longs and shorts, which is still unsettled), which in turn, establish the short-term outlook positive.
However, the major trend looks negative over the long-term, as other future contracts are in backwardation with highest open interest at the January 2019 series.
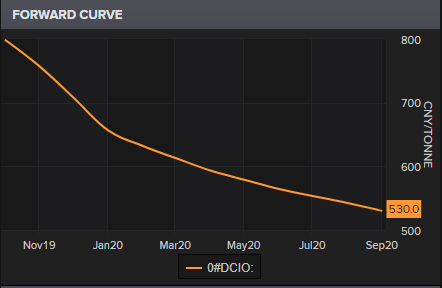
DCE Iron Ore Future Curve (Source: Thomson Reuters)
The downward slope of the futures curve, which is calculated by interpreting the storage cost and the convenience yields (storage cost minus convenience yield), represent that the storage cost for iron ore is exceeding the convenience yield or the benefits of having the physical inventory in hand over the long-run.
To Know More, Do Read: Things to Be Familiar With Before Fishing for Mining Stocks
ASX-Listed Iron Ore Miners
ASX-listed iron ore miners such as Rio Tinto (ASX: RIO), BHP Group Limited (ASX: BHP), Fortescue Metals Group (ASX: FMG), which contributes significantly in the Australian economy, are relishing over the short-term positive outlook over the iron ore; however, these miners have multiple-commodity exposure, which reduces their correlation with a single commodity.
RIO closed the dayâs trade at $91.910, up by over 2.150 per cent from its previous close, while BHP and FMG last closed at $36.530 and $8.950, up by 1.98 per cent and 1.58 per cent from their previous close, respectively (as on 14 October 2019).
Disclaimer
This website is a service of Kalkine Media Pty. Ltd. A.C.N. 629 651 672. The website has been prepared for informational purposes only and is not intended to be used as a complete source of information on any particular company. Kalkine Media does not in any way endorse or recommend individuals, products or services that may be discussed on this site. Our publications are NOT a solicitation or recommendation to buy, sell or hold. We are neither licensed nor qualified to provide investment advice.
