


Crude oil prices are maintaining the uprise in the global market amid middle east concern and shortage in the United States Crude Inventory.
The benchmark Brent Crude oil future rose from the level of US$69.72 (Dayâs low on 13th May 2019) to the level of US$73.36 (Dayâs high on 16th May 2019).
A sudden fall in the crude stockpiles in the United States amidst the middle east concern supported the crude oil prices. The inventory dropped from the level of 9.9 million (reported for the week ended 26th April 2019) to the level of -3.963 million for the week ended 3rd May 2019.
The sudden drop from such a high level of inventory inventory concerned the global participants over the supply chain, which in turn, supported the crude oil prices.
Post declining to the level of -3.963 million, the crude stockpiles in the United States surged to the level of 5.4 million for the week ended 10th May 2019.
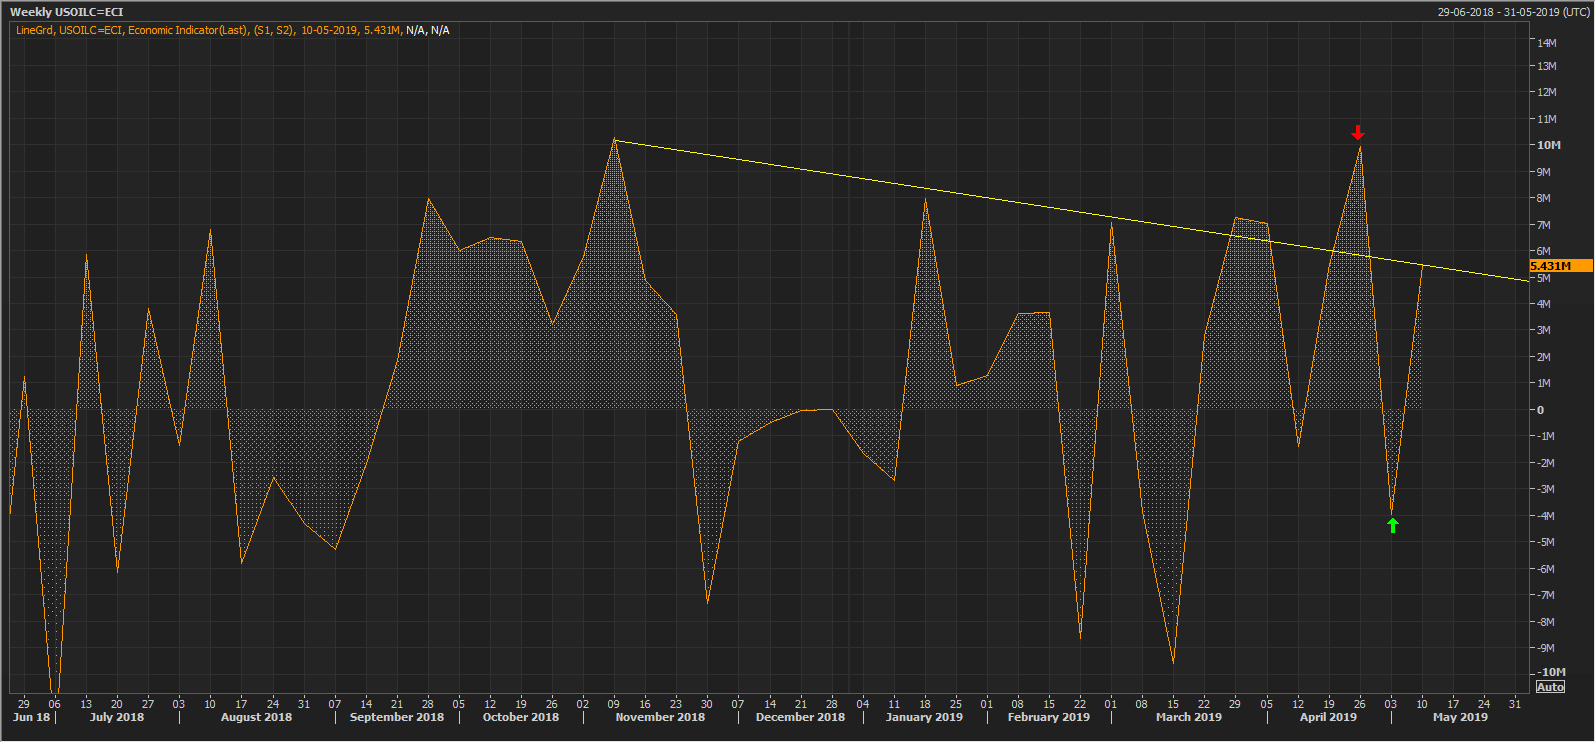 Source: Thomson Reuters; U.S. Weekly Crude Oil Inventory
However, due to the tension of the middle east, the rise in US inventory could not hamper the prices and the prices continued its up-rally in the market. In the recent event, Saudi, the Kingpin of oil, mentioned about the sabotaging of its crude vessels in the Persian Gulf, which in turn created a concern of supply in the market; Middle East being the topmost oil producer and exporter.
Saudi proclaimed that the recent sabotaging of its vessels in the Gulf was by the drone sent from Iran. The indication of possible involvement of Iran in the recent action further concerned the energy market over the supply issue, and the crude oil prices rose.
Middle East is also facing heat of the suspension of the crude export and waiver termination by the United States.
Iran has recently increased its military presence across the border and the recent suspicion on the Iran involvement to stop the crude outflow is concerning the energy sector over a possible supply shortage, especially, when the United States is also marking a decline in inventory (As compared to its top of 9.9 million), which is further adding into the value of every barrel.
Technical Outlook:
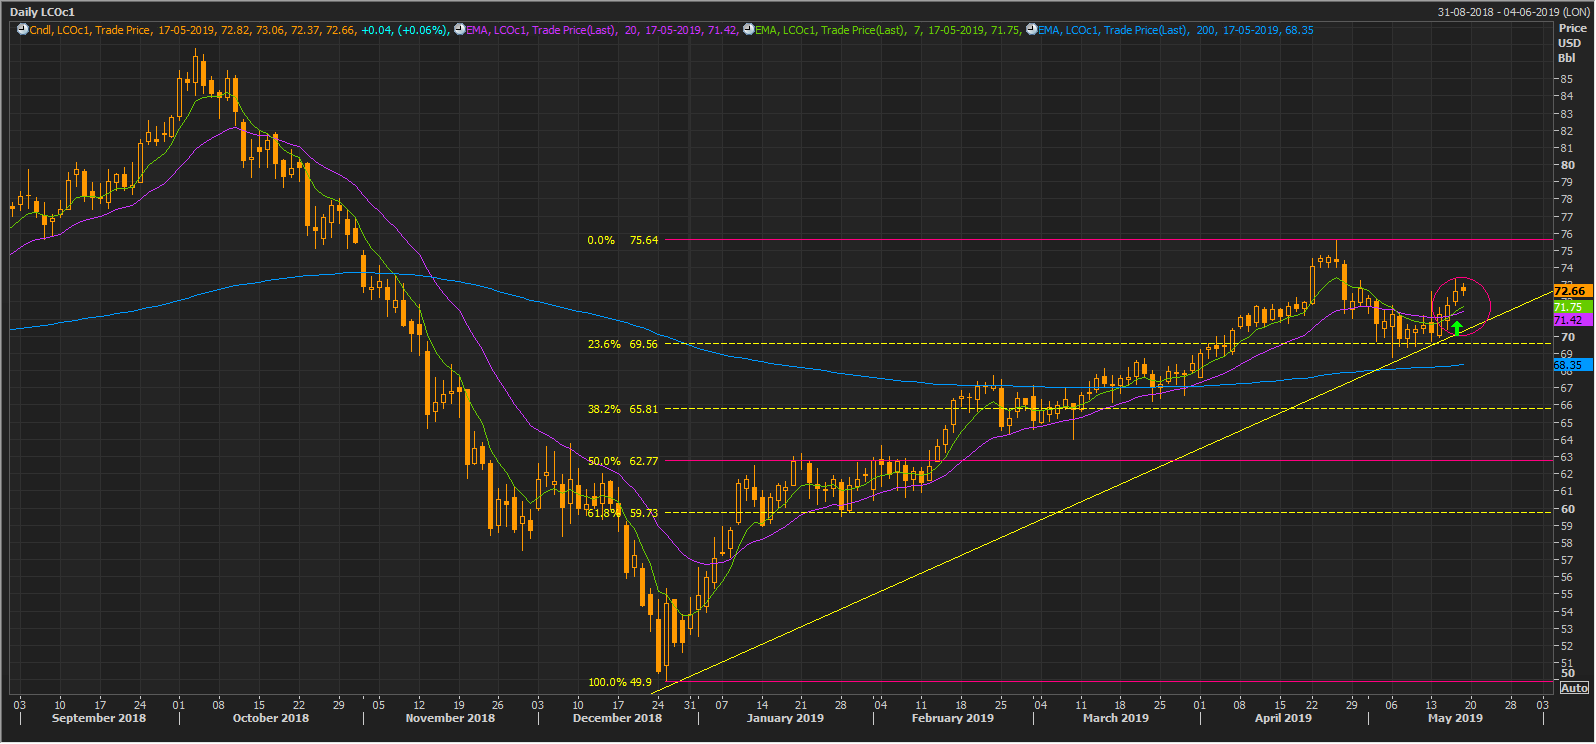 Source: Thomson Reuters; Brent Oil Futures Daily Chart (LCOc1)
The daily chart reveals that the crude oil prices are moving in a continuous uptrend since December 2018; the prices corrected almost 23.6% of the initial uptrend before resuming the original trend. The prices took an initial hurdle around US$75.64 and corrected till 23.6% or approx. US$69.50.
On the indication side, the short-term or 7-days exponential moving average is at US$71.75 and is above the medium-term or 20-days exponential moving average, which is at US$71.42. The gap between both the EMAs is quite less, and the daily chart has shown a Golden Cross-over ( Bullish Signal) marked by the pink circle on the chart.
In our previous article, we mentioned that a strong bull run is required for the respective averages to cross each other, and after showing the bull run, the averages finally crossed each other.
However, to gauge the complete picture, the market participants should monitor the development in the middle east and the role of the United States, which holds the potential of significantly building its inventory and export it to the global market.
The price actions are here denoting the past events, and the next action will be decided upon the successive events, and the OPEC is also due to meet in July. The event study can account for a massive change in the price actions.
Disclaimer
This website is a service of Kalkine Media Pty. Ltd. A.C.N. 629 651 672. The website has been prepared for informational purposes only and is not intended to be used as a complete source of information on any particular company. Kalkine Media does not in any way endorse or recommend individuals, products or services that may be discussed on this site. Our publications are NOT a solicitation or recommendation to buy, sell or hold. We are neither licensed nor qualified to provide investment advice.
