


As per the present scenario where geo-political tensions are its peak, global investors are looking towards safe-haven asset class where gold appears to be one of the best investment options. Five important stocks which are associated with gold exploration or development or production are Ramelius Resources Limited (ASX:RMS), Dacian Gold Limited (ASX:DCN), Bellevue Gold Limited (ASX:BGL), West African Resources Limited (ASX:WAF) and De Grey Mining Limited (ASX:DEG).
Ramelius Resources Limited (ASX:RMS)
Gold Resource company, Ramelius Resources Limited (ASX:RMS) recently published its June â19 Quarter activities report where it highlighted that Groupâs gold production for the period stood at 47,342 ounces at an All-In-Sustaining cost (AISC) of $1,106/oz, where gold production for Mt Magnet (incl. Vivien) and Edna May stood at 30,670 ounces at an AISC of A$1,078/oz and 16,672 ounces at an AISC of A$1,171/oz, respectively. On the full year scale, the gold production stood at 196,679 ounces at an AISC of A$1,192/oz, as compared to 208,118 ounces at an AISC of A$1,191/oz in FY18. Despite capital expenditure of A$28.2 Mn in the Quarter, Groupâs cash & gold at the end of June 30, 2019, stood at A$106.8 Mn as compared to A$104.7 Mn in March â19 Quarter. The company has kept its FY2020 production guidance at 205,000 - 225,000 ounces at an AISC of A$1,225 â 1,325/oz, where gold production for Mt Magnet (incl. Vivien) and Edna May (incl. Marda) have been estimated at 145,800 ounces at an AISC of A$1,100 â 1,200/oz and 68,700 ounces at an AISC of A$1,475 â 1,575/oz, respectively. Group gold production for the September 2019 Quarter is expected to be between 43,000 â 48,000 ounces at an AISC of A$1,375 â 1,475/oz, where gold production at Mt Magnet (incl. Vivien) and Edna May (incl. Marda) have been estimated at 31,000 ounces at an AISC of A$1,350 â 1,450/oz and 14,000 ounces at an AISC of A$1,450 â 1,550/oz, respectively. The Capital & Project development expenditure for the September Quarter has been estimated at A$35.5 Mn, where expenditure at Shannon & Hill 60 undergrounds (Mt Magnet), Eridanus & Stellar open pits (Mt Magnet), Edna May underground, Marda open pit project start-up and Exploration (all Projects) are expected to be A$7.2M, A$9.6M, A$4.5M, A$7.1M and A$7.1M, respectively.
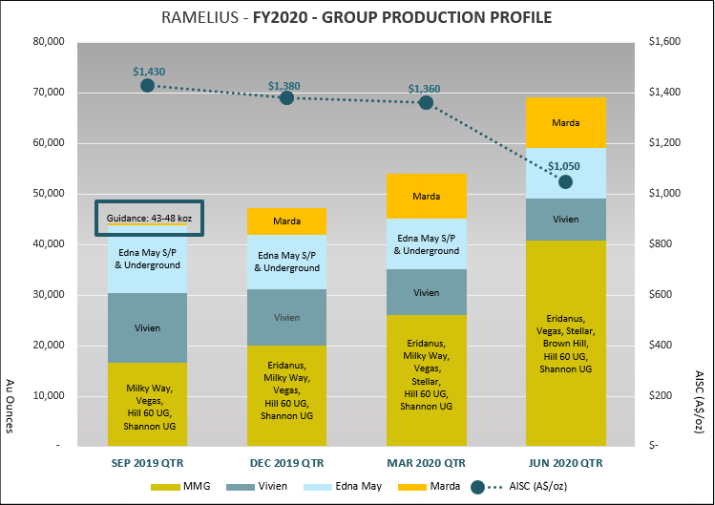
FY2020 Group Production Estimation Data (Source: Company Reports)
On August 2, RMS settled the dayâs trade at $1.105, up 11.616%, reflecting the impact of news tariffs slaaped by the United States on China. Its current PE multiple is at 23.740x and its last EPS was noted at $0.042. Its 52 weeks high and 52 weeks low stand at $1.040 and $0.380, respectively, with an annual average volume of 3,689,589. The stock has witnessed a positive price change of 83.33% over the last one year, 72.17% in the last six months, and 31.13% in the last three months.
Dacian Gold Limited (ASX:DCN)
Dacian Gold Limited (ASX:DCN) recently published its quarterly activities report, where it highlighted that the June â19 Quarter gold production stood at 36,658oz at an AISC of $1,519/oz within updated production guidance of 36,000-38,000oz and AISC guidance of A$1,500- $1,600/oz. The cash and equivalents at the end of June 30, 2019, was reported at $45 Mn after $18 Mn of debt repayment.
At Mt Morgans Gold Operations (MMGO), the companyâs production performance reportedly got impacted by not meeting scheduled mine plan in June Quarter. As per the updated life of mine (LOM) plan, around annual production of 170,000oz at an AISC (All-In Sustaining Cost) of A$1,340-A$1,440/oz are being delivered through 8-year life of mine over first 5 years at Mt Morgans Gold Operations. The FY2020 production guidance has been estimated at 150K-170K ounce at an Mt Morgans Gold Operations All-in-Cost of A$1,400- $1,500/oz, which will include all Mt Morgans Gold Operations capital spend. The consolidated All-In Sustaining Cost over FY2020 has been estimated at A$1,450-A$1,550/oz.
The cash & cash equivalents at the end of June â19 Quarter was reported at A$45 Mn. Its total debt now stands at A$105.5 Mn following repayment of A$18 Mn during the quarter. Companyâs hedge book totals 147,449 ounces at A$1,810/oz through to end of FY2021.

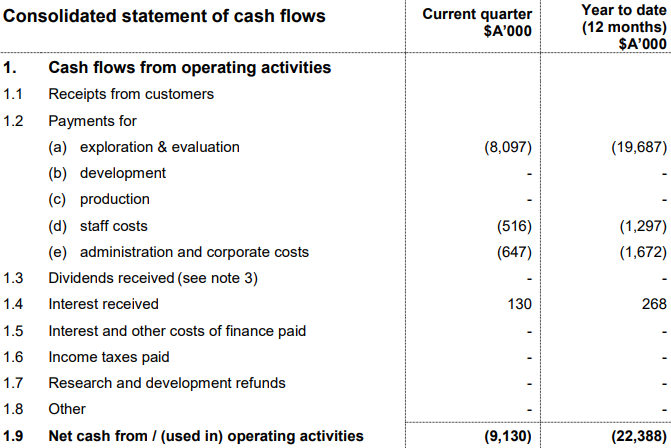
June â19 Quarter Operating Cash Flow Data (Source: Company Reports)
On August 2, DCN settled the dayâs trade at $0.955 up 12.353%, with the market cap of $191.86 million. Its 52 weeks high and 52 weeks low stand at $3.010 and $0.375, respectively, with an annual average volume of 5,482,078. Over the past 12 months, the stock has declined by 70.59% including a negative price change of 56.41% in the past three months.
Bellevue Gold Limited (ASX:BGL)
Bellevue Gold Limited (ASX:BGL) recently announced that it has completed a fully underwritten institutional placement of 32.4 Mn shares at an offer price of A$0.57 per share to raise A$18.5 Mn. BGL in its quarterly activities highlighted that with the delineation of 1.8 Mn ounce gold (Au) within 18 months from discovery, it becomes one of the fastest & highest-grade gold discoveries worldwide. Around 6x diamond core spud rigs onsite targeted Bellevue, Tribune and Viago, surrounds lodes for step-out expansion spudding for further resource growth along with higher confidence infill spudding throughout the year 2019. The regional target at Bellevue includes, three extensive gold trends identified with walk up drill targets along strike of Bellevue Mine. At the end of June â19 Quarter, BGL held strong cash position of $19.8 Mn as compared to $28.7 Mn in the March â19 Quarter.
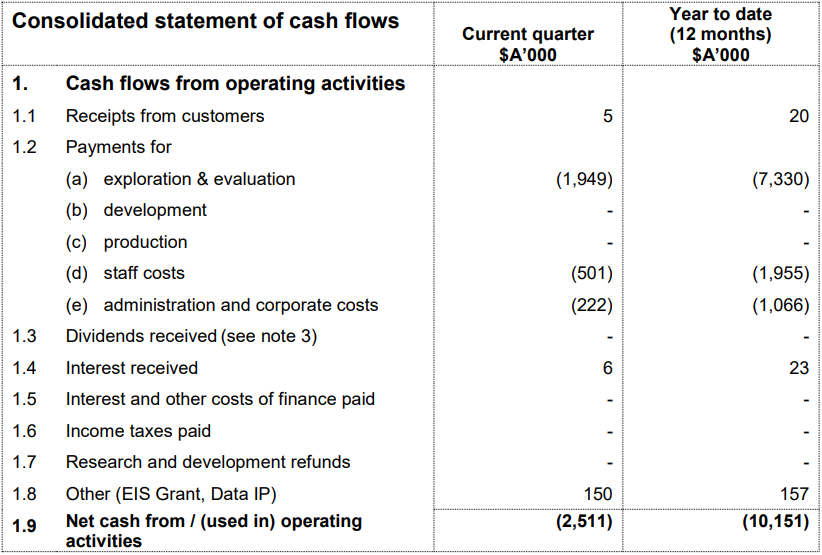
June â19 Quarter Operating Cash Flow Data (Source: Company Reports)
On August 2, BGL settled the dayâs trade at $0.605, up 6.14%, with the market cap of ~$304.96 Mn. Its 52 weeks high and 52 weeks low stand at $0.735 and $0.165, respectively, with an annual average volume of 1,612,057. The stock has generated an absolute return of 235.29% for the last one year, 9.62% for the last six months, and 11.76% for the last three months.
West African Resources Limited (ASX:WAF)
West African Resources Limited (ASX:WAF) recently published its June â19 Quarter report where it highlighted about the progress on its Sanbrado Gold Project, Burkina Faso. The construction and engineering activities at Sanbrado remain on schedule and budget with around 45% completion. The grade control drilling highlights significant results which include:
- 29 meter at 13.2 g/t Au from surface, including 18 meter at 18.2 g/t Au from 11m;
- 20 meter at 7.8 g/t Au (Gold) from surface, including 3 meter at 41 g/t Au (Gold) from 16 meter;
- 8 meter at 13.1 g/t Au (Gold) from surface, including 3 meter at 33.8 g/t Au (Gold);
- 27 meter at 14 g/t Au (Gold) from 2 meter, including 8 meter at 45.1 g/t Au (Gold);
- 28 meter at 6.2 g/t Au (Gold) from surface, including 13 meter at 11.3 g/t Au (Gold) from 4 meter; and
- 25 meter at 6.2 g/t Au (Gold) from surface, including 15 meter at 9.6 g/t Au (Gold) from surface.
As per June 2019 corporate summary, project expenditure and administration costs were reported at A$51.1 Mn and A$0.7 Mn, respectively. The cash and cash equivalents at the end of June 30, 2019, was reported at A$79.3 Mn.
Under its September â19 Quarter plans, WAF highlighted:
- Erection of structural steel for plant
- Completion of all site buildings
- Completion of Tailing Storage Facility (TSF) earthworks on cell 1
- Fill water storage facility (WSF)
- Award of open pit mining contract
- Completion of Sanbrado camp - 270 rooms
- Completion of all resettlement housing
- Continuation of M1 South decline
- Delivery of all mill components to site

June â19 Quarter Operating Cash Flow (Source: Company Reports)
On August 2, WAF settled the dayâs trade at $0.380, up 5.556%, with the market cap of ~$313.37 Mn. Its 52 weeks high and 52 weeks low stand at $0.400 and $0.212, respectively, with an annual average volume of 1,548,472. It has generated an absolute return of 12.50% for the last one year, 50% for the last six months, and 24.14% for the last three months.
De Grey Mining Limited (ASX:DEG)
De Grey Mining Limited (ASX:DEG) recently published its quarterly activities report, where it highlighted that exploration drilling during the quarter focused on Toweranna and Withnell, where Toweranna (DD - 10 holes for 2,555m and RC â 30 holes for 7,240m) comprised:
- 6m @ 6.45g/t, 15m @ 5.11g/t and 8m @ 16.37g/t
- 4m @ 15.26g/t, 4m @ 15.34g/t Au and 7m @ 8.14g/t
- 136m @ 2.0g/t Au from 94m (including 26m @ 3.07g/t and 29m @ 4.38g/t)
And Withnell-1 DD hole for 426m comprised:
- 19m @ 4.39g/t Au from 250.14m; and
- 7m @ 2.91g/t Au from 434m.
- 3m @ 39.21g/t Au from 169m (including 2m @ 57.95g/t Au)
At the end of June â19 Quarter, cash was reported at $1.2 Million. The letter of Intent executed with Novo Resources granted them the right to explore the De Grey tenements for gold bearing lag gravels. The initial right consideration included $1 Million of which $700,000 has been paid and a further $300,000 payable on completion of Indee Gold acquisition.
June â19 Quarter Operating Cash Flow Data (Source: Company Reports)
On August 2, DEG settled the dayâs flat at $0.054, with the market cap of ~$26.35 Mn. Its current PE multiple is at 27.00x and its last EPS was noted at $0.002. Its 52 weeks high and 52 weeks low stand at $0.182 and $0.052, respectively, with an annual average volume of 1,130,073. Over the past 12 months, the stock has declined 67.18% including a negative price change of 31.48% in the past three months.
Disclaimer
This website is a service of Kalkine Media Pty. Ltd. A.C.N. 629 651 672. The website has been prepared for informational purposes only and is not intended to be used as a complete source of information on any particular company. Kalkine Media does not in any way endorse or recommend individuals, products or services that may be discussed on this site. Our publications are NOT a solicitation or recommendation to buy, sell or hold. We are neither licensed nor qualified to provide investment advice.
