


Growth and value are considered as two basic approaches which are considered by an investor before picking up a particular stock or fund.
Investors relate growth to the companyâs earnings growth while value with the current trading price against the actual worth of that stock. Precisely, growth stocks are those stocks that are capable of providing better results with progression and have the potential to surpass the overall market returns. On the other hand, value stocks are those which trade at prices lower than their actual worth. Thus, such stocks provide a superior return in the long term as the traded prices converge with fair values of individual stocks.
Now, the point to note here is that which strategy is better for investing? To answer it, the strategy which is better for investment depends on the time horizon and the risk appetite of the investor.
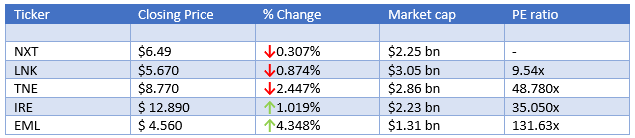
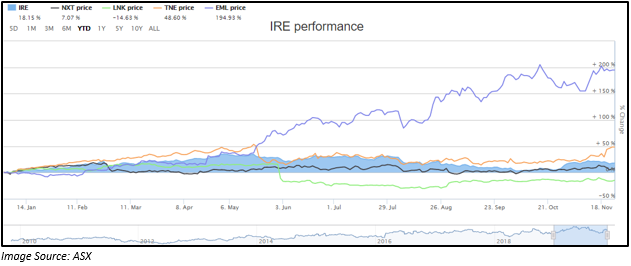
Letâs look at the below 5 technology stocks and discuss their past performance along with future growth prospects.
NEXTDC Limited (ASX: NXT)
FY2019 Highlights (period ended 30 June 2019):
- Revenue increased by 15 percent to $179.3 million as compared to the previous corresponding period (pcp).
- Underlying EBITDA was up 13 percent to $85.1 million.
- A significant increase in the capital expenses was noted during the period from $285 million in FY2018 to 378 million in FY2019.
- A loss of $9.8 million was recorded during the period.
- The operating cash flow increased from $33.4 million in FY2018 to $39.4 million in FY 19.
- Cash and cash equivalent by 30 June 2019 stood at $399 million.
Business Strategies and Future Financial Year Prospect:
The group during the period has established a strong and growing sales pipeline across its operating markets. The group expects that the demand for its carrier and vendor neutral outsourced data centre services would grow in future based on its multiple positive trends like cloud and mobile computing, growth in internet traffic and data sovereignty matters.
NXT has multiple strategies to benefit from the growth. Some of these are:
- Expansion of its presence in data centre markets where its current facilities are close to being fully utilised.
- Continuing to sell uncontracted space as well as power in present facilities.
- Scope for growth ahead of its existing presence in data centres.
- New product launches.
FY2020 Guidance:
- Revenue in FY2020 is expected to range in between $200 million to $206 million.
- Underlying EBITDA is estimated to lie between $100 million to $105 million.
- Capital expenses are anticipated to decline in FY2020 and is likely to be in between $280 million to $300 million.
Link Administration Holdings Limited (ASX: LNK)
FY2019 Highlights (Period ended 30 June 2019):
- Revenue up by 17 percent to $1,403 million on prior corresponding period (pcp).
- Operating EBITDA increased by 6 percent to $356 million.
- Operating NPATA declined by 3 percent and operating EPS by 9 percent on pcp.
- Recurring revenue soared by 18 percent to $1,123 million.
- Net Operating Cash Flow up 6 percent to $339 million.
- Statutory NPAT grew by 123 percent to $320 million.
- LNK declared a total dividend of 20.5 cents per share (fully franked) for FY 2019.
Shareholder value Initiatives:
The company is executing a series of initiatives to drive shareholder value in the short and medium term.
- LNK commenced the global transformation program to deliver savings of no less than $50 million by the end of financial year 2022;
- Portfolio optimisation entailing the sale of CPCS as well as LMS South Africa;
- On market share buyback of a maximum issued capital of 10 percent;
- Foray in the UK pension market;
- Further boost presence of BCM and LFS in the European region;
- With respect to PEXA, LNK is looking at possible capital returns once the business has moved into a stronger positive cash flow situation.
Outlook:
- FY2020 operating EBITDA of the continuing business apart from CPCS and LMS South Africa is anticipated to stronger in the second half and on the whole mostly in-line with FY 2019.
- RSS division revenue would lie in between $480 million to $500 million plus Operating EBITDA from $60 million to $70 million.
Technology One limited (ASX: TNE)
FY2019 Highlights (period ended 30 September 2019):
- Net Profit Before Tax during FY2019 increased by 208 percent to $76.4 million.
- SaaS Annual Recurring Revenue was up 44 percent to $102 million as compared to FY2018.
- Revenue was up by 13 percent to $286 million.
- Expenses declined by 9 percent to $210 million.
- Cash flow from operating activities less capitalised development costs for the period was $45 million, down 14 percent.
- Cash and cash equivalents increased by 1 percent to $105 million.
- Total dividend declared for FY2019 was 11.93 cents per share, representing a growth of 8 percent on pcp.
Outlook:
The companyâs sales pipeline for FY2020 remains robust, and its SaaS business is expected to grow strongly in its new financial year.
Iress Limited (ASX: IRE)
1H FY2019 Results (Period ended 30 June 2019):
- Group revenue increased by 5 percent to $241.8 million on pcp and +3 percent on 2H FY2018.
- Group segment profit was more than 10 percent on pcp and 5 percent on 2H FY2018.
- NPAT declined by 5 percent.
- IRE declared a 10 percent franked dividend of 16 cents per share.
- IREâs fundamentals were strong during the period with cash conversion of 100 percent, recurring revenue of circa 90percent, net debt balance of $193.3 million, signifying a conservative leverage ratio of 1.3x segment profit.
Outlook:
- Iress expects Segment Profit growth in 2019 to be in between 6 percent to 11 percent on a constant 2018 currency basis which comprises of the impact of accounting changes and before the contribution by QuantHouse.
- Including QuantHouseâs acquisition, Segment Profit in 2019 is likely to range from $144 million and $151 million on a constant 2018 currency.
- Non-operating costs excluding the effects of acquisition are expected to be considerably lower in FY 2019 compared to that in 2018. Total of such costs in FY 2019 are expected to be $4 million -$6 million.
EML Payments Limited (ASX: EML)
FY2019 Highlights (Period ended 30 June 2019):
- Group Gross Debit Volume in FY2019 increased by 34 percent to $9.03 bn on pcp.
- Group revenue went up by 37 percent to $97.2 million.
- Group EBITDA grew by 40 percent to $29.1 million.
- Significant growth of 283 percent in Group NPAT to $8.5 million.
- Operating cash inflow during the period was $22.0 million which excludes the one-time benefit of $7.1 million in accelerated breakage cash receipt.
- Cash in hand - $33.1 million. The company has $15 million in loans with a major Australian bank.
Business Development in FY2019:
- Launched its first GPR program with Pointsbet in New Jersey in January 2019 and entered into an agreement with bet365 for their programs in the USA.
- Continued to improve its penetration of the Salary Packaging vertical in Australia. Since the launch of programs on 1 July 2017, the company transitioned 112,000 benefit accounts and ended this financial year with 175,000 benefit accounts, representing organic growth of 56 percent in 2 years.
- Completed its launch with ECE (largest owner and operator of shopping malls in the country) in Germany in October 2018
- Acquired Irelandâs first authorised eMoney institution and a FinTech company, PerfectCard.
- Acquired Flex-e-Card.
- Launched its new mobile-based products using Pays technology in Australia.
Disclaimer
This website is a service of Kalkine Media Pty. Ltd. A.C.N. 629 651 672. The website has been prepared for informational purposes only and is not intended to be used as a complete source of information on any particular company. Kalkine Media does not in any way endorse or recommend individuals, products or services that may be discussed on this site. Our publications are NOT a solicitation or recommendation to buy, sell or hold. We are neither licensed nor qualified to provide investment advice.
