


We are discussing two digital payments related companies with the business model based on - âbuy now pay laterâ. Accordingly, the two companies under discussion are â EML Payments Limited and Splitit Payments Ltd, with a purpose of digging their business phenomenon deeply.
Letâs have a look at the two stocks as mentioned below:
EML Payments Limited
EML Payments Limited (ASX:EML) along with the companies under the group is engaged in the provision of prepaid payment services across Australia, Europe and North America. The company has acquired fintech and payment companies across the globe to increase its product presence.
Financial results; Stellar Growth continues for EML
On 21st August 2019, EML posted its FY19 results for the year ended 30th June 2019 via a media release. The company posted its revenue standing at $97.195 million, ~37% y-o-y increase, followed by 81% y-o-y growth in net profit at $9.026 million. EML retained its previous gross profit margin of ~75% and EBITDA margin recorded at ~30% in FY19 from 29% during FY18. EBITDA numbers came at $29.134 million, growing 40% in the pcp including acquisition expenses. Depreciation and amortisation during FY19 stood at $10.267 million, 17% up from the previous year. The company reported revenue growth across all its major segments.
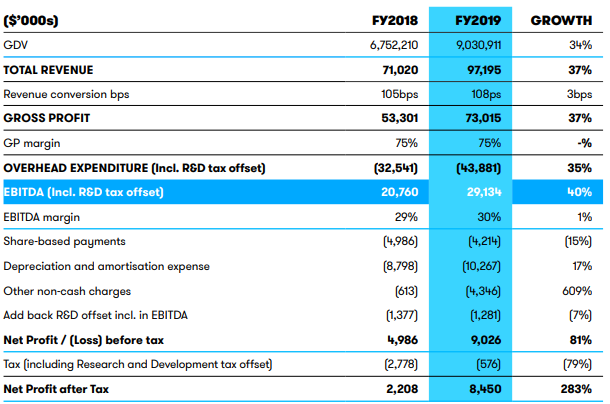
(Source: Companyâs Report)
On the Balance sheet front, the cash and cash equivalent as on 30th June 2019 stood at $33.085 million down from $39.006 million from previous financial year. Other receivables and other assets at the end FY19 came at $34.408 million (~38% y-o-y) followed by receivables from financial institutions at $244.824 million (~262% y-o-y). Deferred tax liability grew 35% from the previous year standing at $7.315 million. The Balance sheet showed a borrowed amount of $15 million. Total equity of the company stood at $144.231 million against $129.773 million in FY18. The Underlying operating cashflow came at $22.1million, which includes a one- time accelerated breakage, that was converted at 76% of EBITDA.
The company reported a jump of 34% in Gross Debit Volume aided by healthy growth across G&I and VANS segments. Cash overheads expense stood at 45.1% in FY19 against 45.8% in FY18. The growth in receivables from financial institutions was aided by introduction of self-issuance across Australia and Europe. Trade & other payables includes contingent consideration on the acquisitions of EML Payments AB and PerfectCard amounted to $11.8m and for this the breakage accrual also increased $12million.
From the cash flow perspective, the company made investments around $49.818 million, that was recorded under Cashflows used in investing activities. During the year, EML invested in an internally generated software worth $4.5m against $3.9m invested during FY18. The company believes that this will aid in the future growth.
Operational Activities
EML launched ECE in Germany during October 2018. ECE is the leading owner and operator of shopping malls in Germany. The company has 90 malls under its operations and the company is anticipating gaining benefit in FY20 period.
Acquisitions and launches during FY19
During July 2018, the group acquired an Ireland based fintech company PerfectCard. The company deals in incentive gift cards and corporate expense solutions to the consumers. Total expense amounted to $0.4 million was incurred in FY19 and the management expects higher margins from European business.
During June 2018, the group acquired Flex-e-Card to increase its presence across Poland and the United Arab Emirates. Flex deals mall gift card programs and have worldwide presence.
Launches during FY19
The company officially launched mobile-based products utilising Pays technology across Australia. With this, the clients would be able to reach customers instantly via Apple Pay, Google Pay and Samsung Pay.
Stock update: The stock EML was last quoted at A$3.65 on 22nd August 2019, up by 6.105% from its previous close. The stock has given stellar returns of 48.28% and 119.11% in the last three and six months, respectively. At the current market price, the stock is available at price to earnings multiple of 307.140x. The stock has last traded towards the higher end of its 52-week trading range of A$1.210 to A$3.740.
Splitit Payments Ltd:
Splitit Payments Ltd (ASX : SPT) is engaged in payments solution business and is a prominent name within monthly instalment payments solution. The payment solution enables customers to pay against their purchases with their existing card (debit or credit) by splitting the cost into interest and fee free instalments, without additional registrations or applications. The company is headquartered at New York and has R&D centre in Israel and other offices situated in London and Australia. The company has global footprint with 500 merchants in 27 nations across the world.
Strategic Partnership with Ally Commerce
On 19th August 2019, SPT announced its strategic alliance with Ally Commerce to provide access to multiple merchants and higher value transactions, without incurring significant additional operational expenses. Ally is an eCommerce service solution company catering to the manufacturers who make sales to the online consumers. As per the companyâs Chief Executive Officer, the above-mentioned alliance provided solid advantages for international organisations and hence the company can derive revenue from this segment.
June Quarter Report
As per the market release on 31st July 2019, the company has posted its quarterly update stating its performance for the period ended 30th June 20t19. The total number of merchants stood at 509 with 72 new clients added during the quarter. SPT has a sales pipeline comprising of more than 700 merchants, presently. Merchant Transaction Volumes for the company stood at A$31.9 million, that grew up by 108% in the pcp followed by Merchant Fees at A$575,100, rising up by 123% y-o-y.
Annual Report - Financial Highlights
On 25 March 2019, the company posted the full year report, for the period ending 31 December 2018. SPT reported gross profit of $389,793 compared to $58,914 in previous year. Research and development expenses came at a loss of $1,029,781 vs a loss of $1,104,053 in FY17 followed by general and administrative expense at a loss of $1,783,022. Total operating expenses during the year stood at a loss of $3,899,387. The company posted net loss of $4,642,975 against a previous loss of $3,422,285 during FY17.
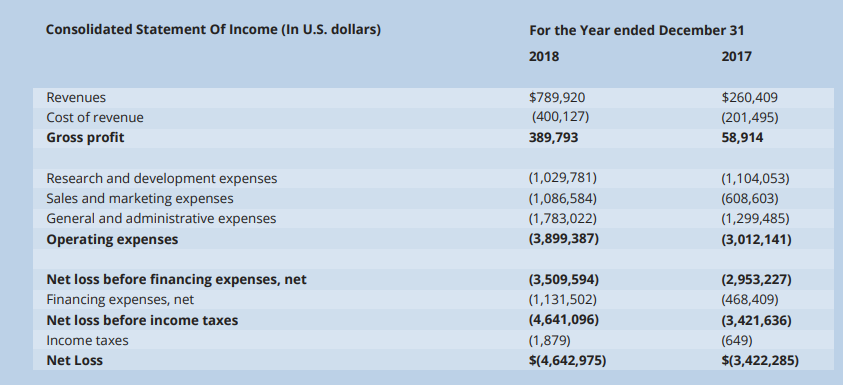
(Source: Companyâs Report)
As far as the Balance sheet is concerned, the current liabilities stood at $16,553,179 comprising trade payables at $1,589,609, a short-term loan of $148,164 and short-term convertible loans of $12,786,669. While other current liabilities stood at $2,028,737. Total share-holders deficiency stood at -$13,114,528. Cash from operations stood at -$ 3,351,916. Purchase of fixed assets during FY18 stood at $74,590. Cash balance of SPT as on 31st December 2018 stood at $309,590.
2019 Outlook
The management guided that the company would target several countries to increase its network presence. SPT has identified US, Canada, UK, Italy, Singapore and Australia where it can enhance its presence across several segments like medical, high-end fashion, sports equipment, home products and in tourism. The company will continue leverage its strategic partnerships with processors payment, platforms, banks, providers sale of point, and large MNCâs. the company will focus on adding new advance, product feature to increase its user base. In FY19, the company will look for acquisitions, will focus on lead generations and sales conversion by enhancing customer base.
Stock update: On 22nd August 2019, SPTâs stock closed at A$0.430, up by 1.176% from previous closing price. The 52-week trading range of the stock stands between A$0.305- A$2.000. The stock of SPT had delivered negative returns of 52.69% and 43.23% in the last three and six months, respectively. The market capitalisation of the stock is A$130.7 million. Total number of outstanding shares of the company stood at ~307.52 million. The stock had closed towards the lower end of 52-week trading range.
Disclaimer
This website is a service of Kalkine Media Pty. Ltd. A.C.N. 629 651 672. The website has been prepared for informational purposes only and is not intended to be used as a complete source of information on any particular company. Kalkine Media does not in any way endorse or recommend individuals, products or services that may be discussed on this site. Our publications are NOT a solicitation or recommendation to buy, sell or hold. We are neither licensed nor qualified to provide investment advice.
