


Summary
- Bitcoin prices are trading in a consolidation range after a steep rally of over 151.0 per cent ahead of the halving day on 12 June 2020.
- The currency is presently witnessing an increase in acceptance day-by-day with recently Bitcoin.com.au- a crypto exchange allowing consumers to pay for their bitcoin over 3,500 Post branches across the continent.
- However, prices of the digital currency now seem to have entered a tug-of-war between bulls and bears with ambivalent sentiments of higher acceptance and lower mining reward (after halving day).
- On charts, bitcoin is currently trading between its support and resistance, while ambivalent sentiments expected to be into consensus soon, leading to a directional move in the digital asset.
Bitcoin prices have been in a strong rally with the prices of bitcoin surging from the level of USD 4,001.0 (intraday low on 13 March 2020) to the level of USD 10,045.0 (intraday high on 7 May 2020), which marked a price gain of ~ 151.0 per cent ahead of the halving day on 12 May 2020.
Halving Day Story, Read Here: Bitcoin Gains Momentum Ahead of Halving Day Deadline; What Are Chartist Looking At?
Post rallying to the high of USD 10,045.0, bitcoin prices corrected slightly over less reward for mining a new bitcoin; however, the basic fundamental of acceptance seems to have supported the bitcoin with prices reaching another high of USD 10,390.0 (intraday high on 1 June 2020), and trading in a thin range since then.
A section of the market participants regard bitcoin as the golden currency of the future, which has emerged out of the blue with the primary aim to decentralise the currency system across the globe, leading to better transparency but certain challenges and nothing supports bitcoin prices apart from better worldwide acceptance.
The acceptance of bitcoin as a standard payment to purchase goods and services have started taking strong roots with many prominent names such as BrewDog, having started taking payments in bitcoin.
To Know More, Do Read: BrewDog Vouches For Bitcoin, While FED Raises Concerns; What’s Next For The Bitcoin?
However, at present, the response concerning bitcoin is still ambivalent with many private and government agencies vouching for the digital asset, while some are banning it permanently.
Also Read: Bitcoin derivative pioneer, Cboe experiences peer pressure after the CME group enters the segment
Now Pay for Your Bitcoin Across 3,500 Post Branches
In the recent past, bitcoin has made a lot of noise around the continent post the announcement from Bitcoin.com.au- a crypto exchange, that Australians can now pay at over 3,500 Post branches for bitcoin purchase across the nation.
As per the exchange, the new scheme has been launched to promote the bitcoin adoption across established businesses and organisations, which is a part of a broader strategy, first unveiled by the exchange in May, to expand the accessibility of bitcoin in order to boost commissions through sales.
The existing customers of the exchange can already purchase and pay for their bitcoin across 1,500 retail outlets, 1,200 newsagents, and through POLi- an online payment option.
With better adoption, bitcoin charts are speaking for themselves with bitcoin trading above its medium-term exponential moving average, suggesting that the primary trend in bitcoin is an uptrend; however, there have been some unique developments on the weekly and daily chart.
Bitcoin on Charts
- Bitcoin on a Daily Chart
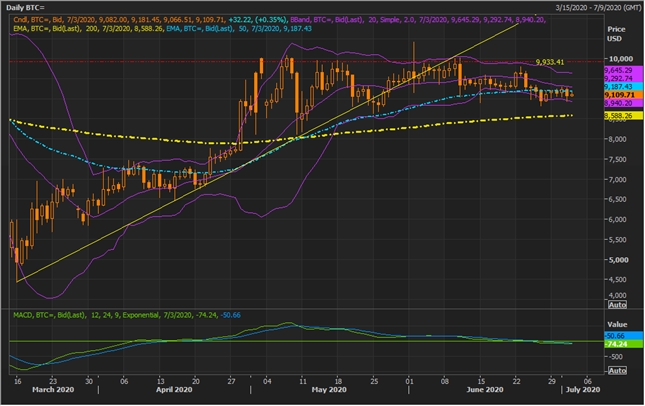
BTC Daily Chart (Source: Refinitiv Eikon Thomson Reuters)
On the daily chart, it could be seen that bitcoin prices slipped below the short-term trendline recently and since then have been trading below the same. However, prices are trading well above the 200-day exponential moving average, suggesting that the primary trend still remains on the upside.
Bitcoin is presently trading below the mean value of a 20-day simple Bollinger band, which should act as immediate and decisive resistance for prices as both the mean value of the Bollinger, and 50-day EMA are overlapping around the same zone.
The major resistance for prices is at USD 9,933.41, which is somewhat overlapping with the +2 Standard Deviation of the 20-day simple Bollinger band; thus, should be decisive.
On the support counter, the -2 SD of the Bollinger band is the immediate support for prices followed by the 200-day EMA.
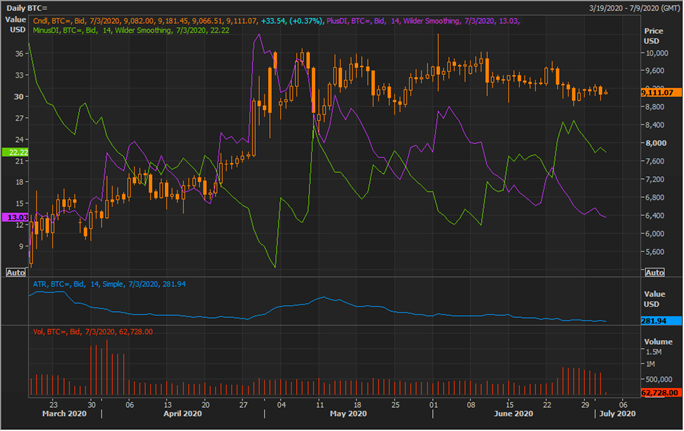
BTC Daily Chart (Source: Refinitiv Eikon Thomson Reuters)
On further applying the plus and minus Directional Indicator on the daily chart, it could be seen that the pair of plus DI and minus DI is showing a negative cross with plus DI slipping below the minus DI, which is further reflecting upon the recent price correction.
However, it should be noticed that the spread between plus DI and minus DI is now enlarging, which coupled with a negative signal from 12,24,9 MACD indicator is suggesting that bearish sentiment is currently prevailing.
Furthermore, while bitcoin prices are trading in the middle of its near-term support and resistance, the Average True Range is declining, reflecting on the current tug-of-war between bulls and bears is finally taking a breather, and soon bitcoin should pick a direction.
- Bitcoin on a Weekly Chart
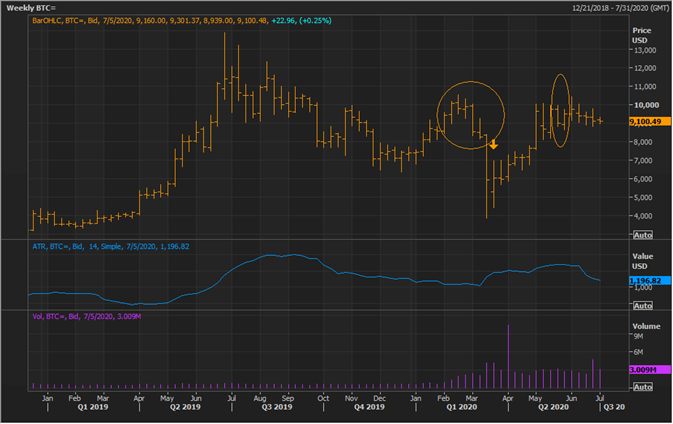
BTC Weekly Chart (Source: Refinitiv Eikon Thomson Reuters)
On following the weekly chart, it could be seen that a reversal pipe formation emerged on the recent top (circled) and bitcoin prices slipped to present an outside long bar.
Post the emergence of the outside long bar, another inside bar emerged, and the successive bar breached the high of the inside bar to establish a bullish setup, after which bitcoin prices surged. However, post rallying slightly, bitcoin prices entered a thin range, reflecting an equilibrium between bullish and bearish sentiments.
Also, it should be noticed that both a higher and a lower close is followed by high volumes, suggesting that bitcoin prices are currently in equilibrium and the falling ATR is further supporting the findings. The future move of Bitcoin would now depend upon its ability to breach and sustain the short-term and medium-term resistance or its inability to do so.
In a nutshell, bitcoin prices rallied till the halving day and post that corrected slightly; however, higher acceptance of bitcoin supported the currency once again. However, in the status quo, bitcoin prices are under a tug-of-war between bulls and bears, which as per signals from above-used indicators is now coming to an end, and soon the currency should show a directional move.
