


Bitcoin prices recently reached above the USD 9,000 mark to trade at a high of 9,438.8 (intraday high on 30 April 2020) and upholding the mark to presently trade at USD 9,119.8 (as on 5 May 2020 3:48 PM AEST).
The market anticipates that currently, the bitcoin hash rate, which denotes the amount of mathematical calculation a bitcoin generating system can handle per second, has inked another all-time high to stand above 140 exahash per second.
On 12 May 2020, the bitcoin blockchain would mark the third block reward halving since inception in 2009, which means that the reward to miners for every block would be reduced by half to stand at 6.25 coins per block as compared to the present level of 12.5 coins per block.
While the halving approaches which aim to keep a curb on the bitcoin supply over time, which if the demand persists could be used as a hedge against the inflation, bitcoin miners seem to be active to take the present reward of higher coins per block.
The approaching deadline of the halving process is supporting the bitcoin in the market, while the higher hash rate is keeping the gain in check; however, many industry experts anticipate that post the halving process bitcoin prices could rise ahead.
So, let us analyse bitcoin charts on multiple timeframes, to set aside the market noise and to find crucial support and resistance, which could serve as a sailing guide amidst high volatility on the bitcoin front.
Bitcoin On Charts
- Bitcoin on the Monthly Chart
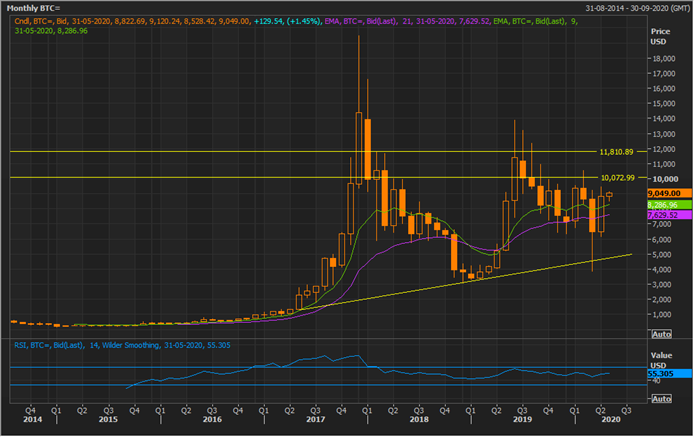
BTC Monthly Chart (Source: EODHD/Others Thomson Reuters)
On the monthly chart, it could be seen that the currency is now poised to test its long-term resistance line of USD 10,073.00 and is presently trading above the pair of short-term and long-term exponential moving averages of 9-month and 21-month with a positive cross between them, suggesting that the asset is moving in an uptrend and bullish sentiments currently prevail. The 14-month Relative Strength Index is moving in tandem with the price and is currently above the mean value when prices are trying to test the long-term resistance, which could be considered as a positive setup.
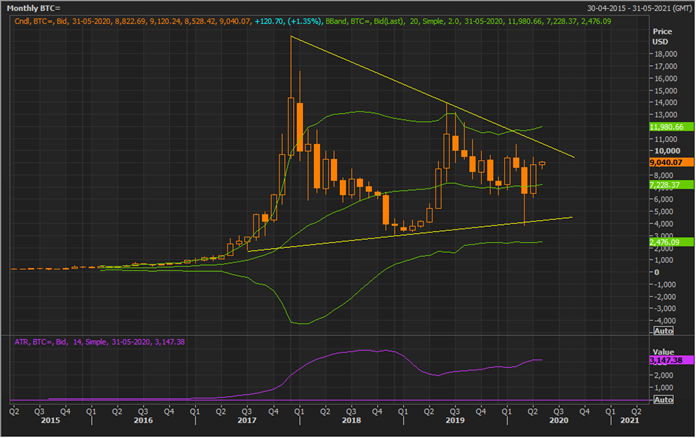
BTC Monthly Chart (Source: EODHD/Others Thomson Reuters)
On further investigating the monthly chart, it could be seen that the price pattern is forming a symmetrical triangle formation, and the asset is currently moving to test the upper range of the triangle. Also, BTC is currently trading above the mean value (middle line) of the 14-month Bollinger band and currently going to test the +1 standard deviation from the mean price, which coupled with a spike is a 14-month average true range, reflects strong upside momentum.
- Bitcoin on the Weekly Chart
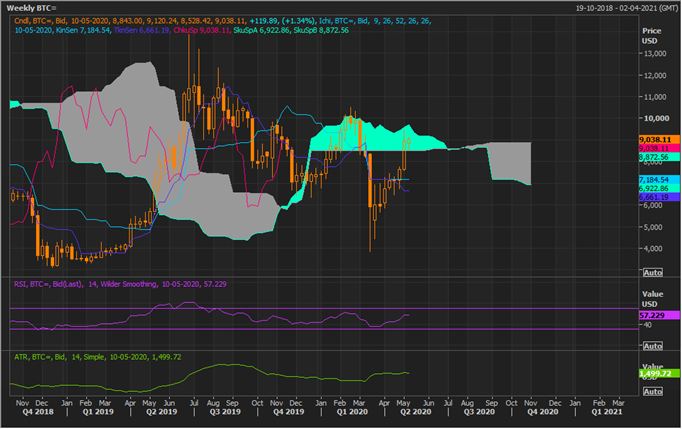
BTC Weekly Chart (Source: EODHD/Others Thomson Reuters)
On the weekly chart, there has been some decent development with prices trying to cross above the resistance cloud. Currently, the asset is trading above the value of both Span A and Span B, which represents the mean value of the conversion line (sky blue) and the base line (dark blue), and the mean value of 52-week high and low, respectively.
Furthermore, the conversion line or the mean value of 9-week high and low is showing a positive crossover with the base line, which represents the mean value of 26-week high and low, which is a positive signal; however, the crossover has taken place below Span A; therefore, the significance of the crossover could be considered as low or moderate.
Also, the spread between Span A and Span B is enlarging (forecasted resistance/ support zone (grey cloud)), which makes the current resistance on the weekly timeframe a significant one. If the asset breach and sustain above the sky blue cloud it would reduce the spread of the forecasted (support/resistance) cloud, which could further act as strong support ahead if prices go above and sustain above the sky blue cloud, while in case of breakout failure above the sky blue cloud, the forecasted grey cloud could act as a significant resistance ahead.
Both the 14-period RSI and ATR are moving in tandem with the price behaviour, and a spike in ATR around the resistance level reflects that the upswing is in momentum.
- Bitcoin on the Daily Chart
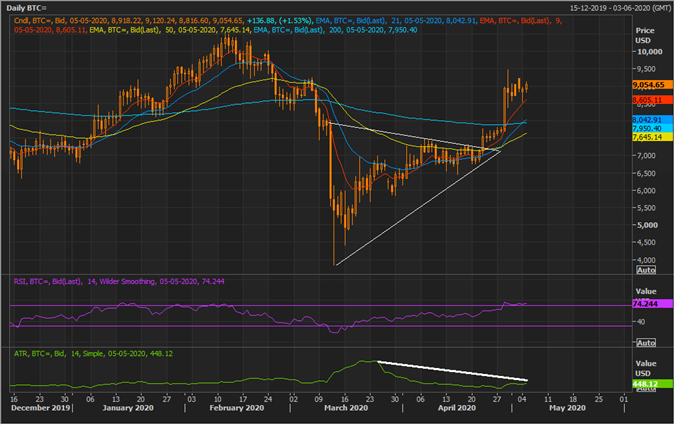
BTC Daily Chart (Source: EODHD/Others Thomson Reuters)
On the daily chart, the crypto-currency has recently given a breakout from a symmetrical triangle formation and is currently trading above the pair of short-term (9,21) and long-term (50,200) exponential moving averages.
While the short-term moving averages are showing a positive cross with each other and with the long-term averages, the long-term pair of 50 and 200-day exponential moving averages are yet not showing a positive crossover, suggesting that on the daily frame the asset is recovering over the short-term, but the corrective phase of the primary rally is yet intact, which would mark its end if the price breach above its long-term resistance level of USD 10,073.00.
Furthermore, post the breakout, the price is showing a decline in volatility, while the 14-day RSI is moving in the overbought zone, which could be an early indication of a possible retracement from the resistance.
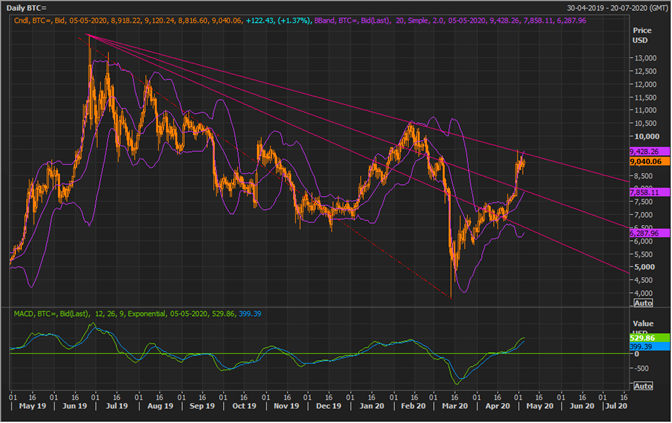
BTC Daily Chart (Source: EODHD/Others Thomson Reuters)
On further taking indication from the RSI and ATR and post applying the Fibonacci fan from the recent high to the recent low, it could be seen that the currency is currently facing a resistance of the 3/3 fraction of the projected Fibonacci resistance fan.
Also, it should be noticed that after a Bollinger squeeze, the currency rose to the +1 standard deviation of the 14-day Bollinger band and as per the standard technical theory, an asset usually retraces post reaching +1 standard deviation to its mean value. However, there are many cases where the band or +/- 1 standard deviation extends, but it requires good indication from momentum indicators, but in the case of bitcoin both the RSI and ATR are showing tiredness now with RSI in overbought region and ATR sloping down, which increases the probability that the current price behaviour of bitcoin could follow the standard theory of Bollinger band.
