


The share market of Australia is amongst the largest and most high-profile financial marketplaces. According to a study conducted by the Reserve Bank of Australia in April 2019, the sum total of the capitalisation of companies listed in the country amounts to almost $2 trillion, with approximately $5 billion shares traded on a daily basis.
The historical milestones of the Australian Share Market
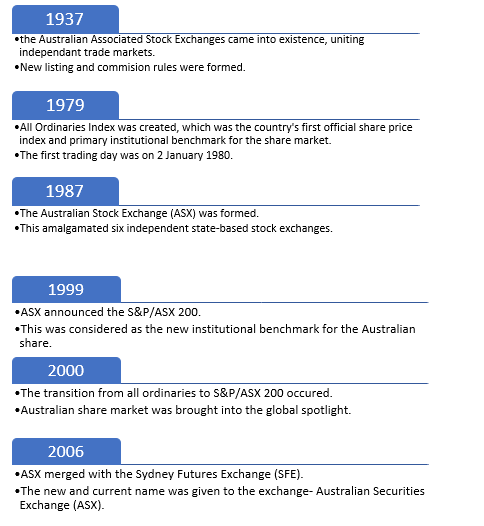
The first ever regional market in Australia was established in Melbourne way back in 1861, taking the Australian stock marketâs existence back in time over 150 years. The additional regional exchanges followed suit, they were established in Sydney, Hobart, Brisbane, Adelaide and Perth. These traded independently until 1937 when the AASE was formed, along with uniformed listing and commission rules.
The below representation is a summarised version of few of the major incidents, rather milestones, that occurred in the past century, pertaining to the Australian share market-
The Australian Equity Market
Presently, Australia is relatively open, trade-exposed economy. This is an indication that any change in a foreign countryâs demand for Aussie goods and services would have a direct impact on the Australian economy. The equity market is amongst the significant sources of funding for the Australian based firms and comprises of a large share of households' retirement savings as well. Many of the huge well-known companies, resource companies and banks are listed on the ASX and they are accountable for a huge chunk of the Aussie output and employment.
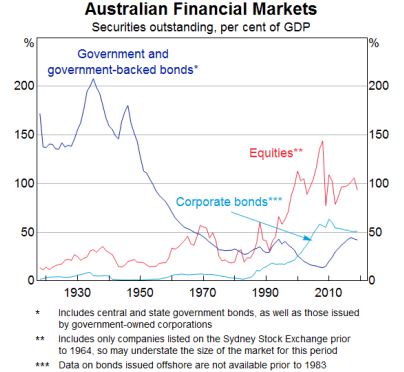
The Australian Financial market (Source: RBAâs publication)
Shareholder Returns from the Aussie Market Space:
A market is truly assessed and considered attractive if it generates good and satisfying shareholder returns. As per RBA report, the share prices have increased by a geometric average of approximately 6 % p.a. over the last 100 years (2% inflation adjusted). Even with phases of over and underperformance, the general trend depicts that the different industrial segments have performed quite similarly. An event of disbalance can be cited from the Great depression, post which the banking sector had tumbled for a much longer period.
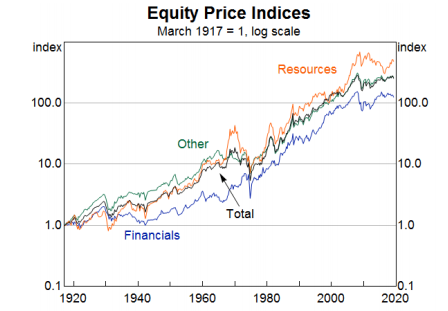
The Australian Equity price indices (Source: ASX)
Coming to dividends, the Australian stocks are known for their high dividend yields. This is because the dividends in the Australian share market are higher than many other countries given their tax treatment. Post the introduction of franking credits, the ratios diverge; dividend payments in the country have remained extremely high.
Based on a market study and considering the returns and dividends in the Australian market, it can be inferred that the total nominal return on equities has been approximately 10 per cent per year over the past 100 year. Post inflation, this rate was around 6 per cent. Over time, the total nominal return on long-term government bonds has been around 6 per cent and an average equity risk premium has been almost 4 per cent.
Structure of Australiaâs Economy:
If we compare the structure of the 1970âs to the early years of 2000, it can be noticed that there had been a decline in the share of output provided by manufacturing with a rise in financial and business services.
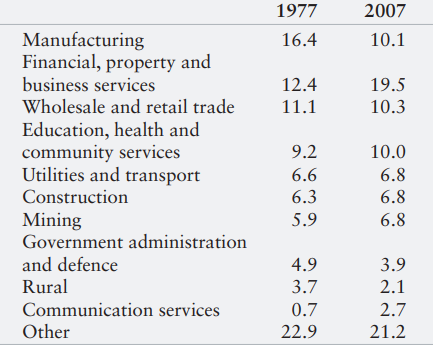
Structure of Australiaâs Economy (% share of GDP) (Source: ABS)
GDP growth over the century:
As per RBA official stats, 1991-2010 has been, by far, the longest period of growth that Australia has recorded this century. Even among the fast-growing emerging economies, a prolonged period of growth is a rare scenario, given various crises that occur over the period, but the Australian performance has been quite appealing in this regard. The countryâs location, exports and population growth has together contributed to this growth. These have been quite evidently backed up by the disciplined financial policies that centre around the Australian economy. Reforms related to competition and industry policy and the labour market reforms also are a significant contributor to Australiaâs GDP growth.
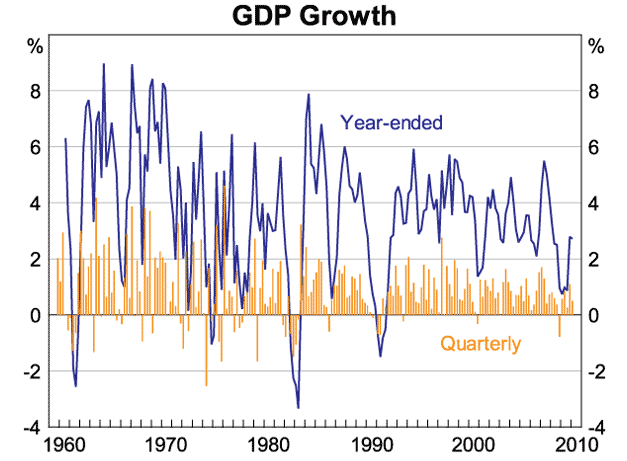
Australiaâs GDP growth (Source: ABS)
According to market experts, the Australian stocks have generated an average return of #% per year (Mid 2017), ever since the 1900s. Hence, it can be rightly inferred that the Australian equity market has grown over the past century to be an important part of the financial system.
The Current Scenario:
In the recent times, where we are sustaining in an era of financial market extremes, the RBA figures state that the P/E ratio for the Australian share market is still at its 80-year average. Facts from the study conducted by RBA prove that there has hardly been any change on the ASX at a high level. Interestingly, there are companies like Bank of New South Wales, ANZ and NAB which have made it to the list of the largest listed business, established 100 years ago and continue to flourish.
Experts suggests that an average listed company in the Aussie land presently is aged 105 years against 77 years in Japan, 95 years in the UK and around 82 years in the US.
Given this backdrop of the Australian share market, let us look at few companies that have top performing stocks on the ASX over the past year:
- Bravura Solution Limited (ASX: BVS)- Operational in the wealth management and funds administration industries, the company is a provider of software products and services to clients to manage and administer their financial products.
The company has generated a YTD return of 43.16%. After the close of the market, the shares were priced at A$5.500, up by 1.103% as on 20th June 2019. The P/E ratio of the stock is 38.970x.
- Afterpay Touch Limited (ASX:APT)- A key Australian Buy-Now-Pay-Later player in the technology software and services sector, the company was listed on ASX in 2017.
The company has generated a YTD return of 83.83%. After the close of the market, the shares were priced at A$23.490, up by 6.482% as on 20th June 2019. The 6-month return of the stock has been slightly better at 84.14%.
- Saracen Mineral Holdings Limited (ASX: SAR)- A company dedicated towards the production and exploration of gold; SAR was officially listed on ASX in 1989.
The company has generated a YTD return of 23.37%. After the close of the market, the shares were priced at A$3.720, up by 3.621% as on 20th June 2019. The P/E ratio of the stock is 40.470x.
- Altium Limited (ASX: ALU)- Working towards the development and sales of computer software for the design of electronic products, ALU has a market cap of A$4.34 billion.
The company has generated a YTD return of 54.00%. After the close of the market, the shares were priced at A$35.130, up by 5.559% as on 20th June 2019. The P/E ratio of the stock is 66.790x.
- IDP Education Limited (ASX:IEL)- An education service provider, IEL was listed on ASX in 2015 and has a market cap of A$4.7 billion.
The company has generated a YTD return of 88.28%. After the close of the market, the shares were priced at A$18.440, slightly down by 0.162% as on 20th June 2019. The P/E ratio of the stock is 75.230x.
Disclaimer
This website is a service of Kalkine Media Pty. Ltd. A.C.N. 629 651 672. The website has been prepared for informational purposes only and is not intended to be used as a complete source of information on any particular company. Kalkine Media does not in any way endorse or recommend individuals, products or services that may be discussed on this site. Our publications are NOT a solicitation or recommendation to buy, sell or hold. We are neither licensed nor qualified to provide investment advice.
