


Letâs have a look over recent developments in the two large-cap stocks as follows:
Telstra Corporation Limited (ASX:TLS)
On June 25, 2019, the stock of Telstra Corporation Limited (ASX:TLS) was up by 0.521%. As per the media reports, the Aussie telecom operator has moved from being on the receiving end of Canberraâs nationwide broadband network and competitive pain to being given a helping hand with government intervention and a stalemate on both Huawei and the proposed TPG/Vodafone merger.
In another update, TLS announced that due to good progress on its T22 strategy, it is expected to make a non-cash impairment and write down of the value of its legacy IT assets by approximately $200 Mn, as a result of bringing forward a consultation on proposed job reductions.
H1FY19 Key Highlights: On a reported basis, total income decreased by 4.1% to $13.8 Bn. The EBITDA on a reported basis decreased by 16.4% to $4.3 Bn, and the NPAT fell by 27.4% to $1.2 Bn. TLSâ core business after excluding nbn performed well. During the half year period, the company added ~0.23 Mn additional retail postpaid mobile services, of which ~0.12 Mn services were on Belong. Around ~0.31 Mn nbn connections were added during the half year period, which helped TLS in maintaining its market share of 51% (excluding satellite).
The company is on track to reduce its overall cost, and remains committed to achieve its FY19 targets, which is a part of its goal to achieve $2.5 Bn net productivity improvement by the year 2022. During the half year period, underlying fixed costs fell by ~4.2% or around $162 Mn. TLS achieved annualised costs reductions of around $900 Mn since FY16. It aims to accelerate its productivity program in H2 FY19 and into FY20.
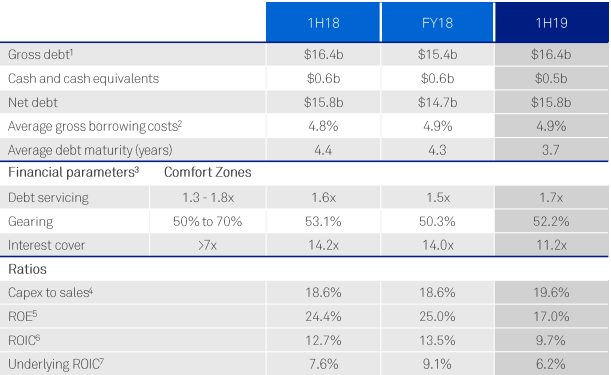
H1FY19 Financial Metrics (Source: Company Reports)
FY19 Guidance: The company expects its FY19 total income to be in the range of $26.2 Bn to $28.1 Bn. Its EBITDA, excluding restructuring costs, is expected to be between $3.1 Bn and $3.6 Bn, wherein around $1.5 Bn to $1.7 Bn of EBITDA is likely to come from one-off nbn definitive agreement receipts minus the nbn net cost to connect. Its capital expenditure is expected to be in the ambit of $3.9 Bn to $4.4 Bn, and its free cash flow is likely to be at the lower end of the guided range of $3.1 Bn to 3.6 Bn. The reason for the lower end for the cash flow being the expected increase in the cash capital expenditure (CapEx) as the company starts taking advantage of the vast available opportunities in the wholesale and enterprise fibre markets, and cash redundancies which are expected to be higher as the productivity increases.
On the stock information front, on June 25, 2019, the stock of Telstra Corporation last traded at $3.860, up 0.521%, with a market capitalisation of ~$45.67 Bn. Its current PE multiple is at 14.71x, and its last EPS was noted at 0.261 AUD. Its annual dividend yield has been noted at 3.26%. Today, it reached dayâs high at $3.880 and touched dayâs low at $3.835, with the daily volume of 15,173,907. Its 52 weeks high price was at $3.880 and 52-weeks low price at $2.547, with an average volume of 27,473,196 (yearly). Its absolute returns for the past one year, six months and three months are 41.86%, 39.27%, and 15.24%, respectively.
Amcor plc (ASX:AMC)
On June 25, 2019, stock of Amcor plc (ASX:AMC) rose up by 1.141%. As per the media report, the top brokers are giving Buy rating to the AMC stock; the primary reason can be attributed to the selling off non-core assets with the combination of Amcor-Bemis. The proceeds generated from the divestment activities could be used for the share buyback of up to US$1 Bn. The brokerage houses also believe that there is good upside potential from the merged synergies.
As per the forecast for FY19, the current consensus earnings per share (EPS) and DPS has been estimated at 87.3 cps and 65.5 cps, respectively, implying a prospective dividend yield of 4.2%. Current consensus EPS estimate suggests that PER is around 17.8. As per the forecast for FY20, the current consensus earnings per share (EPS) and DPS has been estimated at 98.6 cps and 71.2 cps, respectively, implying a prospective dividend yield of 4.6%. Current consensus EPS estimate suggests that PER is around 15.8.
In another update, AMC announced that Mr Paul Brasher will retire from the Board of the company by September 30, 2019, due to health-related issues.
H1FY19 Key Highlights: Sales revenue increased by 4.3% (on a constant currency basis) to US$4,551.8 Mn as compared to the previous corresponding period. The underlying profit after tax (PAT) increased by 3.4% (on a constant currency basis) to US$328.5 Mn as compared to the previous corresponding period. Its profit before interest and tax increased by 2.4% (on a constant currency basis) to USD 509.6 Mn as compared to the previous corresponding period. Its operating cash flow increased by 27% to USD 115.3 Mn as compared to the previous corresponding period.
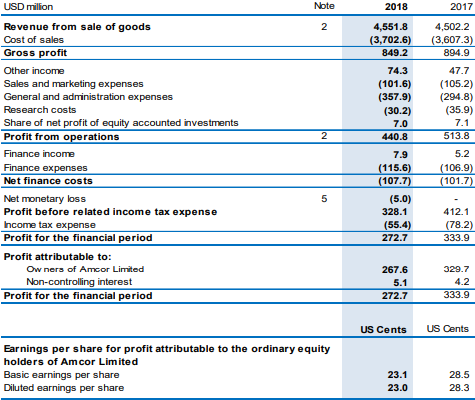
H1FY19 P&L Statement (Source: Company Reports)
Outlook: The company expects its net interest costs to be between US$200 Mn to US$210 Mn in the constant currency terms. The cash interest paid is likely to be in line with the profit and loss charge. The cash tax payments are expected to be in the range of 85% and 95% of the profit and loss charge. The free cash flow after deducting CapEx and dividend payments is expected to be in the range of US$200 Mn to US$300 Mn.
On the stock information front, at market close on June 25, 2019, the stock of Amcor plc last traded at a price of $15.96, up 1.141%, with a market capitalisation of ~$25.62 Bn. Its current PE multiple is at 19.51x, and its last EPS was noted at 0.809 AUD. Its annual dividend yield has been noted at 5.02%. Its dayâs high was noted at $16.080 and touched dayâs low at $15.850, with a daily volume of 8,422,958. Its 52 weeks high price is at $16.670- and 52-weeks low price at $12.665, with an average volume of 5,594,992 (yearly). Its absolute returns for the past one year, six months and three months are 9.66%, 21.20%, and 3.75%, respectively.
Disclaimer
This website is a service of Kalkine Media Pty. Ltd. A.C.N. 629 651 672. The website has been prepared for informational purposes only and is not intended to be used as a complete source of information on any particular company. Kalkine Media does not in any way endorse or recommend individuals, products or services that may be discussed on this site. Our publications are NOT a solicitation or recommendation to buy, sell or hold. We are neither licensed nor qualified to provide investment advice.
