


An Exchange Traded Fund (ETF) can be understood as a type of investment fund that an investor can buy or sell on the securities exchange market. ETFs enables investors to invest in a variety of stocks within a single trade. The basic idea behind investing in the ETF is to diversify the risk by investing in a range of sectors or asset classes. ETFs are required to get registered as MIS (Managed Investment Schemes) under the Corporations Act. When an investor buys an ETF, each unit accounts for an equivalent interest in a portfolio of assets held by the fund. As per www.asx.etfs.com, there are ~195 ASX listed ETFs to choose from with the total index market capitalisation of ~56,149 million as on July 1, 2019.
There are two types of ETFs in the Australian market:
Passive ETFs or ordinary ETFs basically track a benchmark, such as an index, sector, commodity, etc. Such ETFs aim to perform in line with the underlying benchmark and generate identical returns, excluding fee. The variation in the returns between the two is âtracking errorâ. Generally, fees with Passive ETFs are inferior to Active ETFs and Managed Funds. SPDR S&P/ASX 200 (STW) is the largest Passive ETF, which trades on the Australian Stock Exchange with the underlying benchmark of S&P/ASX 200 Index.
Active ETFs are dynamically managed with a goal to outperform the underlying benchmark and achieve a different investment objective. The popular Active ETF is the BetaShares Australian Equities Bear Hedge Fund (BEAR), with the intention to generate returns that are negatively correlated to the returns of the S&P/ASX 200 Accumulation Index.
How an ETF Works?
To understand the working fundamentals of ETF, letâs look at an example. The SPDR S&P/ASX 200 Fund (STW) intends to perform in line with or above replicate S&P/ASX 200 index. STW will purchase all the 200 participants of the S&P/ASX 200 Index with the same weightage of scrips. Consequently, the movement in the S&P/ASX 200 will be imitated by the STW, after subtracting management fees. Hence, an investor, investing in STW should expect, in a broad manner, the similar returns as generated by S&P/ASX 200.
ETFs Advantage: There are various benefits from ETFs, which can be understood as:
- ETFs are easy to trade and can be bought or sold like ordinary shares with the existing brokerage account.
- Through ETFs, an investor can invest in different types of asset classes like commodities, foreign exchange market, precious metals.
- ETFs also can be used for the portfolio diversification as one can invest in different sector. However, sectoral ETFs can also be preferred over others, in case, the respective sector has a decent outlook in the medium to long term.
- ETFs also facilitates with short sell in the market.
Top 10 Exchange Traded Funds By Market Capitalisation: Below table highlights the Top 10 ETFs in Australia in terms of market capitalisation and their weightage.
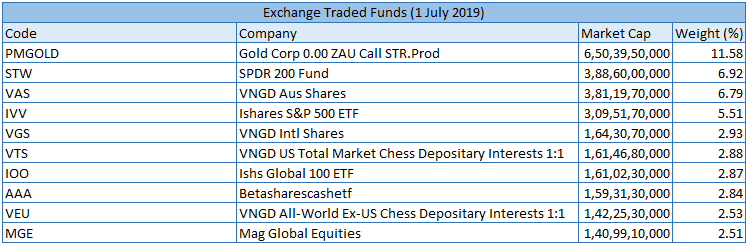
Top 10 Exchange Traded Fund (Source: ASX)
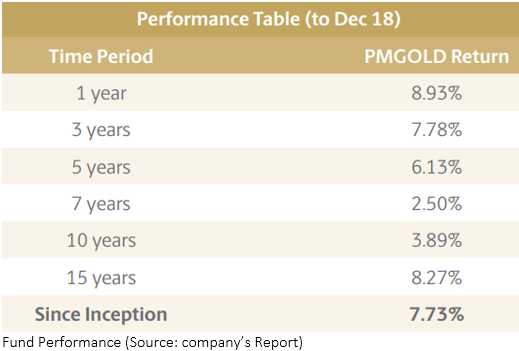
Gold Corp 0.00 ZAU Call STR.Prod (ASX:PMGOLD) is designed to track the international price of gold in Australian dollars and trades like a regular share through a stock broking account. Each unit of PMGOLD accounts for ownership of 1/100th of a troy ounce of gold. The fund has generated returns of ~8.935% and 7.78% in one-year and three-year, respectively. The fund was incepted as on 9th May 2003. The annual management fees stand at 0.15%. The fund is highly liquid as it invests in only physical gold, which is being one of the liquid assets.
Perth Mint is the largest precious metals business in Australia, with an annual turnover surpassing $18 billion. The company stores physical metal of more than $3 billion on behalf of ~40,000 clients, which includes individual investors, superannuation trustees, central banks and sovereign wealth funds, etc.
SPDR 200 Fund (ASX:STW): tracks the S&P/ASX 200 Index to closely match its return (before fees and expenses). The objective of the fund is to provide portfolios with low portfolio turnover, accurate tracking and lower costs. The fund was incorporated on 24th August 2001. The fund has given a return of 15.32% in the last six months as at 31st May 2019. The fund holds ~201 securities with a dividend yield of 4.23% and management cost of 0.19% per annum. Top 5 holdings of the funds are - Commonwealth Bank of Australia (8.09%), BHP Group Ltd (6.51%), Westpac Banking Corp (5.69%), CSL Ltd (5.44%) and Australia And New Zealand Banking Group (4.83%). Looking at the sector breakdown, Financials ex-Real Estate Investment Trusts holds the highest weight of 32.37%, followed by Materials at 18.40% and Healthcare at 8.38%.
As on 01st July 2019, Net Asset Value (NAV) for the fund stood at $61.64, with total funds under management at $3,930.83 million.
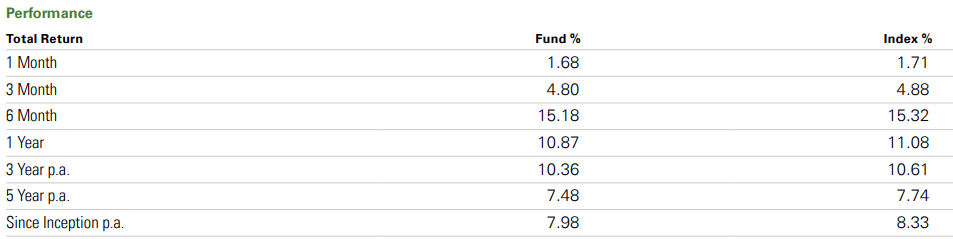
Fund Performance (Source: Companyâs Reports)
Vanguard Australian Shares Index ETF (ASX:VAS) recently reduced the management fees to 0.10% per annum w.e.f. 1st July 2019 from 0.14% p.a. With more than $6.8 trillion in AUM as of 30th June 2018, including more than $1.1 trillion in ETFs, VAS is the worldâs largest global investment management company. In Australia, VAS has been serving financial advisors, institutions, etc., for more than 20 years. On ASX, the fund is trading at a market price of $84.080, towards its 52-week high level. The annual dividend yield for the fund came in at 4.48%.
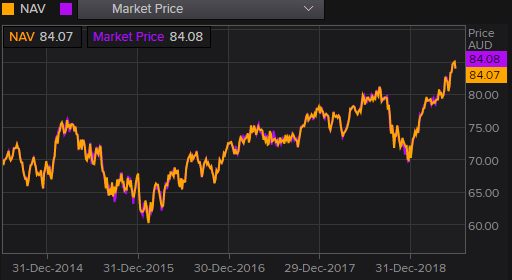
VAS Price Performance (Source: Thomson Reuters)
Currently, the fund is trading at $84.580 (as at AEST: 01:57 PM, 03 July 2019), close to its 52-week high.
iShares Global 100 ETF (ASX:IOO) is managed by BlackRock Investment Management (Australia) Limited (BIMAL). Recently, the fund manager reported 23,002,661 outstanding units of the fund (IOO) as on 30th June 2019. In a previous update, BIMAL announced cash distribution of 81.968823 cents per unit for IOO as on 28th June 2019. The redemption orders on the funds will be deferred on 4th July 2019, due to the occasion of US Independence Day holiday. The application for redemption will reopen on 5th July 2019. Meanwhile, units of such funds between the period will remain unavailable for trading on ASX.
The fund commenced to trade on ASX on 10th Oct 2007, with an inception date of 5th December 2000. The fund has generated an annualized return of 11.62% in the last one year.
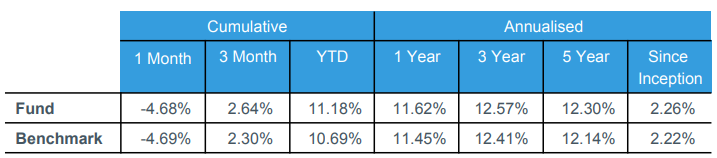
Cumulative and Annualised Performance (Source: Company Reports)
Top 5 holdings of the funds include Microsoft Corp (8.22%), Apple Inc. (6.59%), Amazon.com Inc. (6.18%), JPMorgan Chase & Co (2.91%) and Johnson & Johnson (2.91%). The fund has higher exposure towards Information Technology (20.52%), followed by Healthcare (14.85%) and Consumer Staples (13.31%).
Looking at the country breakdown, the fund mainly invests in the United States (64.79%). As per the fact sheet, as of 31st May 2019, P/E ratio stood at 17.59x, with a price-to-book at 2.38.
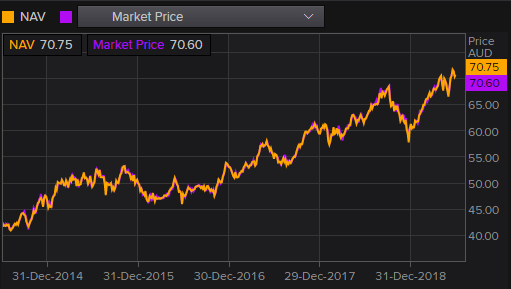
IOO Price Performance (Source: Thomson Reuters)
At present, the fund is trading at a market price of $70.600 (as at AEST: 01:57 PM, 03 July 2019), towards its 52-week high level of $71.870. The annual dividend yield stands at 1.77%.
VNGD Intl Shares (ASX:VGS) is managed by Vanguard Investments Australia Ltd. Recently, the fund manager provided the information to the market related to the distribution for the period ending 30th June 2019. Amount close to 72.9679 cents per unit will be distributed with Record Date and Payment Date on 2nd July 2019, and 16th July 2019, respectively. The dividend reinvestment plan (DRP) is available for the fund at an issue price of $74.8129.
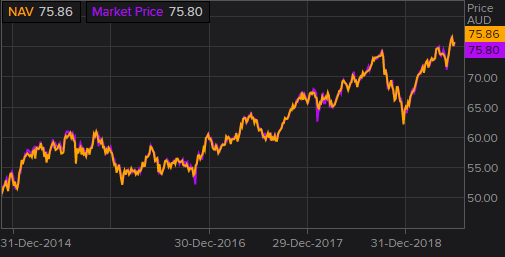
VGS Price Performance (Source: Thomson Reuters)
At present, the fund is trading at market price of $75.770 (as at AEST: 01:57 PM, 03 July 2019), towards its 52-week high level of $76.920.
iShares S&P 500 ETF (ASX:IVV) is managed by BlackRock Investment Management (Australia) Limited (BIMAL). In the recent announcement to the market, around 7,360,698 outstanding units of IVV were reported as on 30th June 2019. In a previous update, BIMAL announced cash distribution of 227.223769 cents-per-unit for IVV as on 28th June 2019. The fund manager also informed the market that the redemption orders on the funds will be deferred on July 4, 2019, due to the occasion of the US Independence Day holiday. The application for redemption will reopen on July 5, 2019. Meanwhile, units of such funds between the period will remain unavailable for trading on ASX.
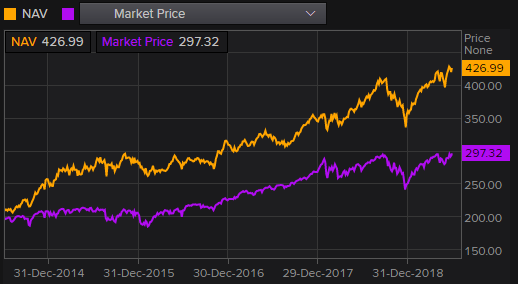
IVV Price Performance (Source: Thomson Reuters)
At present, the fund is trading at market price of $426.000 (as at AEST: 01:57 PM, 03 July 2019), towards its 52-week high level of $430.270. The annual dividend yield stands at 4.48%.
Magellan Global Equities Fund (ASX:MGE) is an actively managed, ASX quoted fund. The size of the fund is $1,353.5 million. The fund was incorporated on 2nd March 2015. The management and admission fee for the fund is 1.35% per annum, as per the fact sheet as of 31st May 2019. The sector exposure is tilted towards Information Technology (20%), followed by Consumer Defensive, Internet and E-commerce, Payments (each 13%).
Looking at the performance, the fund has given a negative return of 2.75 in the last one month, however, it has generated 17.5% return in the last one year.
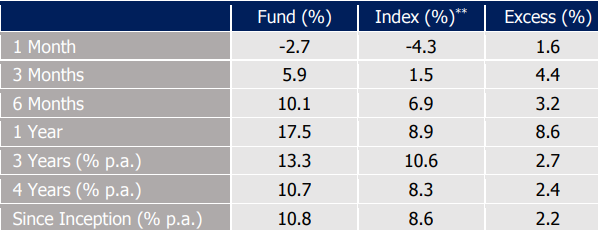
Fund Performance (Source: Companyâs Reports)
As far as the geographical exposure is concerned, the fund is highly focused on the US with 46% exposure.
Currently, MGE is trading at a market price of $3.730 (as at AEST: 01:57 PM, 03 July 2019), inching towards its 52-week high level.
Disclaimer
This website is a service of Kalkine Media Pty. Ltd. A.C.N. 629 651 672. The website has been prepared for informational purposes only and is not intended to be used as a complete source of information on any particular company. Kalkine Media does not in any way endorse or recommend individuals, products or services that may be discussed on this site. Our publications are NOT a solicitation or recommendation to buy, sell or hold. We are neither licensed nor qualified to provide investment advice.
