


Recession is the period, where the economy suffers from the economic slowdown induced due to global or local factors. 2008-2009 market downturn is the best example to describe recession, which was triggered by the housing bubble burst in America. Many global markets declined over 50% during the period, but still in that turbulence, many stocks did not follow the course or in other words, did not show signs of hurting decline due to their decent fundamentals and dividend yields, and are popularly referred as âDefensive Stocksâ. Five of such stocks, which could be seen as the light at the end of tunnel in the recessionary period, are Coles Group Limited (ASX:COL), Sydney Airport (ASX:SYD), Scentre Group (ASX:SCG), Transurban Group (ASX:TCL), and Woolworths Group Limited (ASX:WOW). Letâs see how these stocks have performed based on their recent updates.
Coles Group Limited (ASX:COL)
Coles Group Limited (ASX:COL) recently announced the update on Investor Day, which will be held on June 18, 2019. The briefing is expected to commence at AEST 9:30 AM and may conclude at around AEST 12:30 PM. In its 2019 third-quarter sales results, COL reported an increase of 3.2% in sales revenue to $7,272 million. Its comparable sales growth (%) increased by 151 bps pcp to 2.4% and sales per square meter ($) increased by 0.9% pcp to $16,612 million.
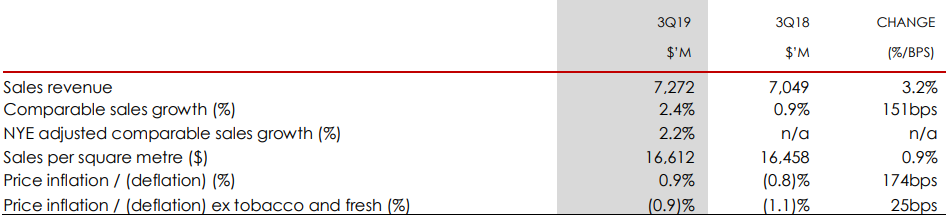
Q3FY19 Financial Metrics (Source: Company Reports)
The company is committed to increasing convenience in the life of its customers. According to the third quarter sales data, its overall sales momentum remains broadly in line with the second quarter of FY19. Its newly announced Supermarket and Express collectables program is expected to encourage adoption of a healthy lifestyle (eating more fresh fruit and veggies) by Australian kids and their parents. The new store EBA, drought and energy challenges are expected to increase input costs. The company expects to pay its final dividend for the year ending June 30, 2019, which will also be its first dividend payable in September 2019. It implies seven months of earnings post the demerger processes. The Board of Directors has re-affirmed its target dividend payout ratio of 80% to 90% for the six months from November 28, 2018, to June 30, 2019, payable in September 2019.
On the stock information front, at market close (on June 6, 2019), the stock of Coles Group was trading at $12.65, down 0.706%, with a market capitalisation of ~$16.99 billion. Its current PE multiple is at 23.03x, and its last EPS was noted at $0.553. Today, it reached dayâs high at $12.780 and dayâs low at $12.600, with a daily volume of 1,849,817. Its 52 weeks high was at $13.370 and 52 weeks low at $11.120, with an average volume of 2,634,602 (yearly). Its absolute returns for the past six months, three months and one month are 7.78%, 11.95% and 0.79%, respectively.
Sydney Airport (ASX:SYD)
Sydney Airport (ASX:SYD) recently made an announcement, where recent decisions of the European Unionâs Court of Justice after the finalisation and release of the companyâs FY18 financial reports, have prompted review of the position of indemnities provided by SAT1 in regard to the sale of Copenhagen Airport in 2011. In its Annual General Meeting, the company highlighted that the total passengers increased by 2.5% to 44.4 million in FY18, where international passengers and domestic passengers increased by 4.7% and 1.2%, respectively. Its revenue for the period increased by 6.8% to $1,584.7 million and net operating receipts increased by 9.4% to $860.9 million. The total movements decreased by 0.3%, wherein international movements increased by 4.4% and domestic movements decreased by 0.5%. Its EBITDA for the period increased by 7.2% to $1,282.6 million and full-year distribution per stapled security increased by 8.7% to 37.5 cents.
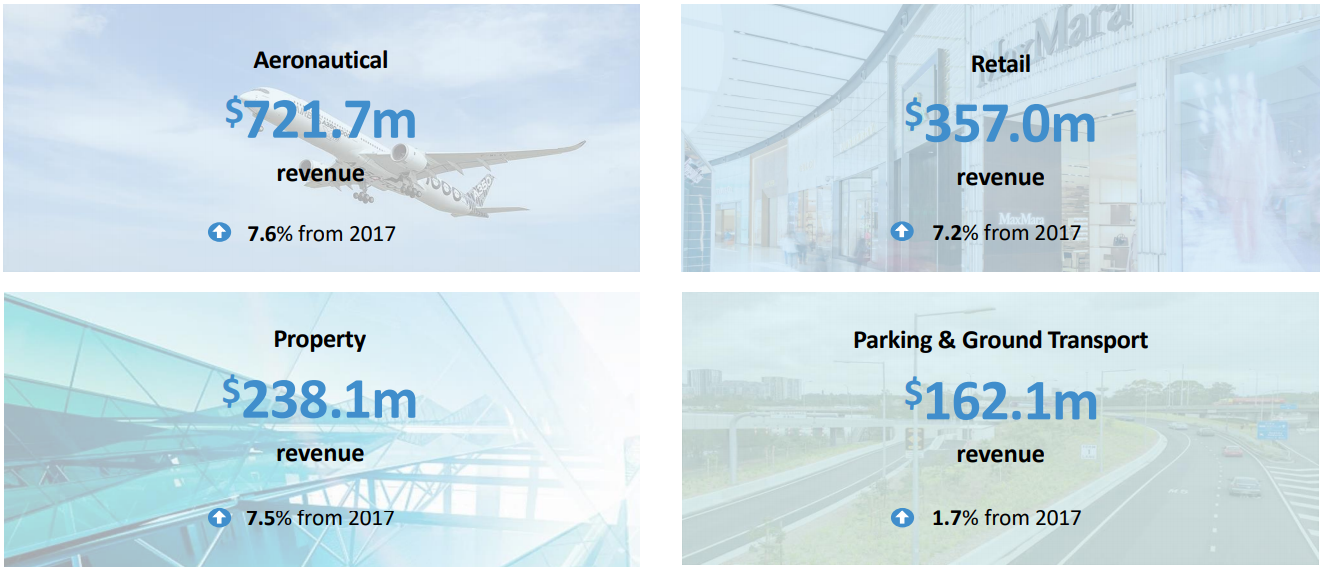
Division by Revenue (Source: Company Reports)
In its performance for the month of April, total traffic increased by 0.1% pcp to 3.68 million, wherein international traffic increased by 2.5% pcp to 1.4 million and domestic traffic decreased by 1.3% to 2.28 million. Geographically, maximum traffic was witnessed from the USA and Philippines at 13.2% and 12.1%, respectively.
On the stock information front, at market close (on June 6, 2019), the stock of Sydney Airport was trading at $7.440, up 0.541%, with a market capitalisation of ~$16.7 billion. Its current PE multiple is at 44.770x, and its last EPS was noted at $0.165. Its annual dividend yield was reported at 5.2%. Today, it touched dayâs high at $7.490 and dayâs low at $7.400, with a daily volume of 3,925,376. Its 52 weeks high was at $7.900 and 52 weeks low at $6.240, with an average volume of 5,669,468 (yearly). Its absolute returns for the past one year, six months and three months are 3.06%, 8.01%, and 4.21%, respectively.
Scentre Group (ASX:SCG)
Scentre Group (ASX:SCG) recently announced that it has entered into the partnership with Perron Group as a new 50% joint venture partner in Westfield Burwood in Sydney, where Perron Group will make a payment of $575 million for its interest. This amount represents a 4.1% premium to Scentre Groupâs book value as on December 31, 2018, which also highlights the companyâs extraordinary platform of 41 Westfield living centres. The proceeds will help the company to repay its debt and pursue important objectives to create long-term value for its shareholders. Its forecast distribution for the year 2019 remains unchanged at 22.60 cents per security. In its first quarter operating update, SCG highlighted that its platform is the regionâs leading platform for consumers, brands and experiences to connect and interact. Its integral infrastructure network covers more than 65% of the population within a 30-minute drive of a Westfield living centre. The group generated $24.1 billion of annual retail in-store sales across Australia and New Zealand, of which 7.5% of all retail sales occur through the Westfield platform. It's current and future development activity is more than $3.7 billion.

Operating Performance (Source: Company Reports)
The group reaffirms forecast funds for operation (FFO) growth for the 12 months ending December 31, 2019, to be around 3%. The distribution for FY19 is forecasted to be 22.60 cents per security, which is 2% up than the prior period.
On the stock information front, at market close (on June 6, 2019), the stock of Scentre Group was trading at $3.790, up 1.882%, with a market capitalisation of ~$19.78 billion. Its current PE multiple is at 8.630x, and its last EPS was noted at $0.431. Its annual dividend yield was reported at 5.96%. Today, it touched dayâs high at $3.810 and dayâs low at $3.740, with a daily volume of 10,159,943. Its 52 weeks high was at $4.535 and 52 weeks low at $3.630, with an average volume of 12,567,438 (yearly).
Transurban Group (ASX:TCL)
Transurban Group (ASX:TCL) recently announced the distribution of around 30.0 cents per stapled security for the six months ending June 30, 2019, which will comprise 28.0 cents distribution for Transurban Holding Trust and controlled entities. This takes the total FY19 distribution to $0.59 per stapled security, of which $0.03 will be fully franked. The Board of Directors have determined that no discount will be applied when determining the price for the Distribution Reinvestment Plan (DRP). Its pricing period in relation to the distribution will be 10 trading days, commencing July 4, 2019. The key dates for the distribution and the DRP are:
- Securities Trade âex-distributionâ on 27th June 2019
- Record Date on 28th June 2019
- Last date for Elections under DRP on 1st July 2019
- Payment Date and DRP Allotment Date on 9th August 2019.
In its March â19 quarterly update, TCL highlighted that average daily traffic (ADT) increased by 2.3% with growth achieved across all the markets. The average daily traffic in Sydney increased by 2.1% to 813,000 trips. Of the total ADT, car traffic increased by 2.3% and large vehicle traffic decreased by 0.1% for the quarter. The average daily traffic at Melbourne increased by 3.1% to 856,000 transactions. Of the total ADT, car traffic and large vehicle traffic increased by 2.5% and 5.6%, respectively for the quarter. For the quarter, Brisbane ADT increased by 1.1% to 400,000 trips, despite the impact from construction disruption. For the quarter, North America ADT was reported at 136,000 trips, which was a growth of 2.9%.
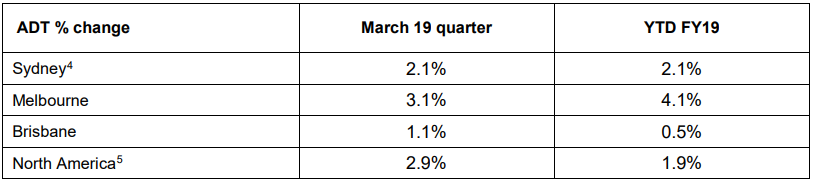
Traffic Performance (Source: Company Reports)
On the stock information front, at market close (on June 6, 2019), the stock of Transurban Group was trading at $14.230, up 0.628%, with a market capitalisation of ~$38.31 billion. Its current PE multiple is at 121.360x, and its last EPS was noted at $0.118. Its annual dividend yield was reported at 4.12%. Today, it touched dayâs high at $14.510 and dayâs low at $14.180, with a daily volume of 6,212,902. Its 52 weeks high was at $14.590 and 52 weeks low at $10.620, with an average volume of 5,168,952 (yearly). Its absolute returns for the past one year, six months and three months are 24.55%, 23.34%, and 15.39%, respectively.
Woolworths Group Limited (ASX:WOW)
Woolworths Group Limited (ASX:WOW) recently announced the change in the interest of substantial holder, where BlackRock Inc. and its subsidiaries, increased its voting power from 5.00% to 6.43%, effective from May 27, 2019. It recently completed selective off-market buy-back of 58,733,844 shares at the value consideration of $1,699,757,445.36. The company is in compliance with all Corporations Act requirements relevant to this buy-back. In its third-quarter sales result, WOW highlighted that Australian Foodâs sales momentum showed an improvement in the third quarter with Easter-adjusted sales growth of 4.7%, which benefitted from lower deflation and decent weather, despite drought and flood effects on vegetable and fruit prices, availability and quality, customers score remained high.
With positive comparable growth from BWS and Dan Murphyâs assisted by the timing of New Yearâs Eve and weather, Endeavour Drinksâ Easter-adjusted sales increased by 6.4%. New-Zealand (NZ) food Easter-adjusted sales grew 2.9%, supported by a good online growth. Due to growth in Everyday, Leisure and Home, Big Wâs Easter-adjusted sales increased by 5.6%. Hotel businessâ Easter-adjusted growth was reported at 2.7%. The improvement in the growth was driven by Bars and Food. Groupâs online sales grew over ~35%. The successful sale of Woolworths Petrol to EG Group helped the company to generate proceeds of $1.7 billion, which it aims to distribute to valuable shareholders.
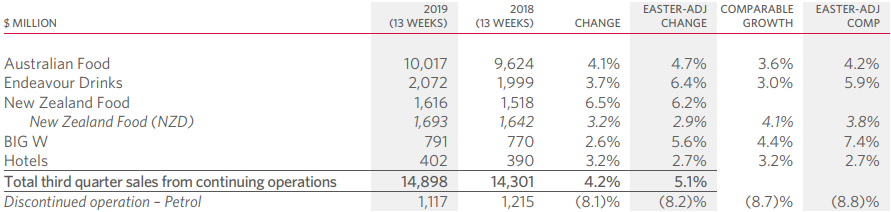
Third Quarter Sales for WOW (Source: Company Reports)
During the period, WOW reported 15 total gross new stores (incl. acquisitions), 11 net new stores (incl. acquisitions), and 14 renewals/refurbishments. The Australian Food (including Metro) business reported 4 gross new stores, 2 net new stores, and 3 renewals/refurbishments. The Endeavour Drinks business (including attached) reported 7 gross new stores, 6 net new stores and 6 renewals/refurbishments. The Big W business reported 1 gross new stores, and Hotels business reported 3 gross new stores, 3 net new stores, and 5 renewals/refurbishments.
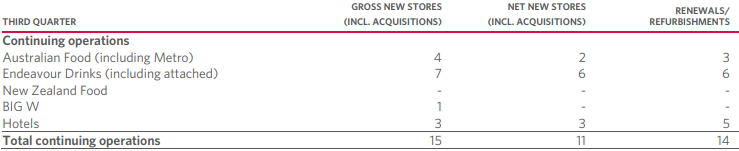
New Stores and Renewals/Refurbishments (Source: Company Reports)
On the stock information front, at market close (on June 6, 2019), the stock of Woolworths Group was trading at $31.330, up 0.449%, with a market capitalisation of ~$39.26 billion. Its current PE multiple is at 23.550x, and its last EPS was noted at $1.324. Its annual dividend yield (DY) was reported at 3.05%. Today, it touched dayâs high at $31.580 and dayâs low at $31.300, with a daily volume of 2,676,816. Its 52 weeks high was at $34.840 and 52 weeks low at $27.030, with an average volume of 3,873,000 (yearly). Its absolute returns for the past one year, six months and three months are 9.52%, 7.66%, and 4.84%, respectively.
Disclaimer
This website is a service of Kalkine Media Pty. Ltd. A.C.N. 629 651 672. The website has been prepared for informational purposes only and is not intended to be used as a complete source of information on any particular company. Kalkine Media does not in any way endorse or recommend individuals, products or services that may be discussed on this site. Our publications are NOT a solicitation or recommendation to buy, sell or hold. We are neither licensed nor qualified to provide investment advice.
