


Introduction
Income stocks represent stocks with either higher dividend yields or growth stocks with high capital appreciation. Five such stocks are Westpac Banking Corporation (ASX:WBC), National Australia Bank Limited (ASX:NAB), WAM Capital Limited (ASX:WAM), The Star Entertainment Group Limited (ASX:SGR) and Lendlease Group (ASX:LLC).
Westpac Banking Corporation (ASX:WBC)
Westpac Banking Corporation (ASX:WBC) is engaged in providing financial services such as deposit taking, lending, payments services, superannuation and funds management, investment portfolio management and advice, leasing finance, insurance services, foreign exchange services, general finance and interest rate risk management. As per an exchange filing on September 3, 2019, bank decreased its stake in Pendal Group Limited from 11.93% to 10.50%, effective from August 30, 2019. Other update includes Westpac Self-Funding Instalments over securities in ASX Limited, with a final dividend of $1.1430 and special dividend of $1.2910, taking the final amount to $2.4340 per security (fully franked), with record date and payment date on 6 September 2019 and on or about 25 September 2019, respectively. Westpac Self-Funding Instalments over securities in BHP Group Limited includes estimated dividend of $1.1499 per security (fully franked), with record date and payment date on 6 September 2019 and on or about 25 September 2019, respectively. Q3FY19 Key Highlights: Common equity Tier 1 (CET1) capital ratio was reported at 10.5% on June 30, 2019.In terms of credit quality, there was a small increase in impaired assets over the quarter by $0.1bn to $1.9bn. Total provision balances increased by 1.8%, and the total provisions to gross loans were unchanged at 56 bps. Its Australian mortgage for ninety day plus delinquencies was reported at 0.9%, which was 8 basis points up over the quarter. Its average liquidity coverage ratio (LCR) was reported at 137%, net stable funding ratio was reported at 111%, both well above the regulatory requirements.
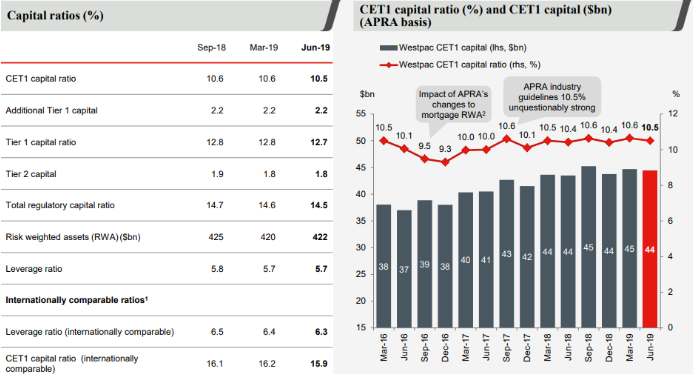
CET1 Capital Ratio Key Metrics (Source: Company Reports)
On the stock price performance,
On September 5, WBC settled the dayâs trade at $28.490 up 0.85%, with the market cap of ~$98.59 Bn. Its current PE multiple is at 13.710x, dividend yield is at 6.65% and its last EPS was noted at $2.061. Its 52 weeks high and 52 weeks low stand at $29.110 and $23.300, respectively, with an annual average volume of 5,728,126. It has generated an absolute return of -0.21% for the last one year, 4.63% for the last six months, and 3.67% for the last three months.
National Australia Bank Limited (ASX:NAB)
National Australia Bank Limited (ASX:NAB) offers services related to banking, credit card, leasing, housing and general finance. The bank simultaneously is engaged in the international banking, investment banking, wealth management, funds management and custodian, trustee and nominee services. The Bank recently announced that it became substantial holder in the Link Administration Holdings Limited, with interest of 5.048%, effective from August 29, 2019.
Q3FY19 Key Highlights: Unaudited statutory net profit for the period was reported at $1.70 Bn. Unaudited Cash earnings for the period was reported at $1.65 Bn. Group Common Equity Tier 1 ratio (CET1) on June 30, 2019 was reported at 10.4%, as compared to 10.4% as on March 31, 2019, but excludes $1 Bn (25 bps of CET1) of H1FY19 Dividend Reinvestment Plan underwrite proceeds, which were received in July. Leverage ratio (APRA basis) for the period was reported at 5.4%. Liquidity Coverage Ratio (LCR) quarterly average was reported at 128%. Net stable funding ratio was reported at 113%.
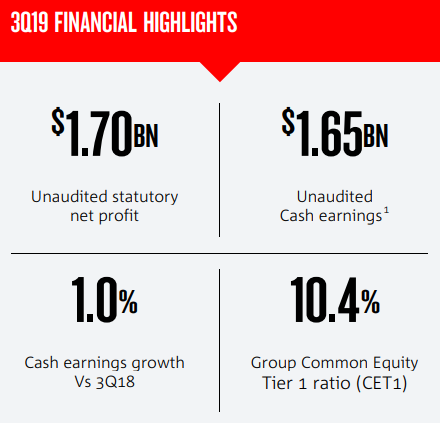
Q3FY19 Key Metrics (Source: Company Reports)
On the stock price performance,
On September 5, NAB settled the dayâs trade at $27.510 up 0.695%, with the market cap of ~$78.76 Bn. Its current PE multiple is at 13.320x, dividend yield is at 6.66% and its last EPS was noted at $2.051. Its 52 weeks high and 52 weeks low stand at $28.780 and $22.520, respectively, with an annual average volume of 5,874,137. It has generated an absolute return of -3.19% for the last one year, 8.46% for the last six months, and 3.37% for the last three months.
WAM Capital Limited (ASX:WAM)
WAM Capital Limited (ASX:WAM) has investments in excess of $3 billion in undervalued Australian and global growth companies. It has a client base of over 80,000 shareholders (retail investors). The company recently reduced its stake in Noni B Limited (ASX:NBL), from 7.09% to 5.77%, effective from August 27, 2019.
FY19 Key Highlights: Revenue from ordinary activities decreased by 86.3% to $25,790,268 over previous year. Profit from ordinary activities before income tax expense decreased by 96.4% to $5,987,601 on previous year. Net profit from ordinary activities after income tax expense decreased by 88.4% to $14,533,222 on the previous year. Net tangible asset backing (after tax) per share decreased from $1.98 on June 30, 2018 to $1.87 on June 30, 2019.
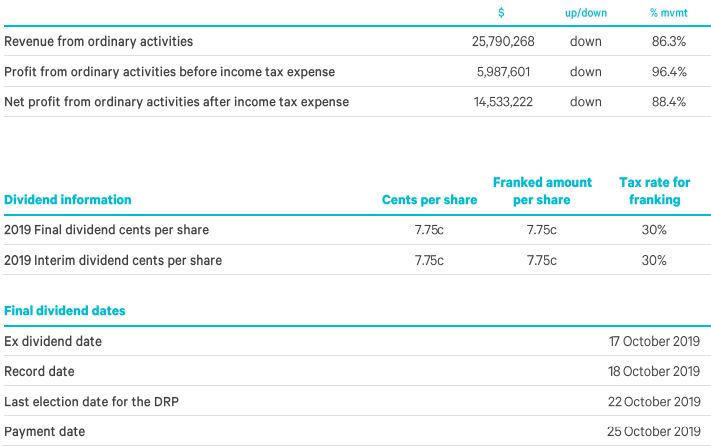
FY19 Key Metrics (Source: Company Reports)
On the stock price performance,
On September 5, WAM settled the dayâs trade at $2.170 down 0.459%, with the market cap of ~$1.56 Bn. Its current PE multiple is at 13.320x, dividend yield is at 7.11% and its last EPS was noted at $0.021. Its 52 weeks high and 52 weeks low stand at $2.520 and $1.920, respectively, with an annual average volume of 587,704. It has generated an absolute return of -12.10% for the last one year, -3.54% for the last six months, and 6.86% for the last three months.
The Star Entertainment Group Limited (ASX:SGR)
The Star Entertainment Group Limited (ASX:SGR) manages integrated resorts along with gaming, entertainment and hospitality services. The company recently announced change in its directorsâ interest where Katie Lahey acquired 10,000 ordinary shares at value of $3.7952, taking the final holdings to 46,907 shares, effective from August 22, 2019.
FY19 Key Highlights: Statutory Net Revenue for the period increased by 3.6% to $2,158 Mn on previous year. Statutory EBITDA (before significant items) for the period increased by 14.1% to $553 Mn. Statutory NPAT (before significant items) increased by 17.1% to $216 Mn, and statutory NPAT increased by 33.7% to $198 Mn. The Board of Directors declared fully franked final dividend of 10 cents per share, taking the total dividend to 20.5 cents per share (fully franked). The record date and payment date for final dividend are on August 22, 2019 and September 26, 2019, respectively.
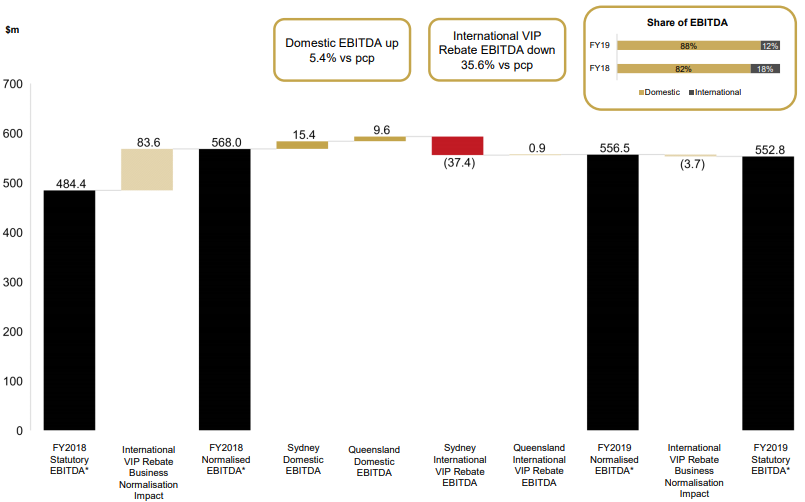
FY19 EBITDA Performance (Source: Company Reports)
On the stock price performance,
On September 5, SGR settled the dayâs trade at $4.160 up 2.211%, with the market cap of ~$3.73 Bn. Its current PE multiple is at 18.840x, dividend yield is at 5.04% and its last EPS was noted at $0.216. Its 52 weeks high and 52 weeks low stand at $5.660 and $3.560, respectively, with an annual average volume of 6,323,890. It has generated an absolute return of -25.05% for the last one year, -10.28% for the last six months, and -5.96% for the last three months.
Lendlease Group (ASX:LLC)
Lendlease Group (ASX:LLC) is a leading international property and infrastructure group, with around 13K employees across operations in Australia, Asia, Europe and the Americas. The company in its FY19 annual report highlighted that its total revenue remained almost flat on comparison to FY18 at $16,555 Mn. EBITDA for the period was reported at $867 Mn, which is a 30% down on previous year. Underlying operating cash flow for the period was reported at $316 Mn, which is a 65% decrease on previous year. Net assets for the period was reported at $6,357 Mn, which is a 1% decrease on previous year. Net debt for the period increased by 21% to $1,425 Mn. Earnings per security for the period was reported at 82.4 cents per share, which is 39% decrease on previous year. Distribution per security for the period was reported at 42 cents per share, which is a 39% decrease on previous year.

FY19 Core Business EBITDA Mix (Source: Company Reports)
On the stock information front
On September 5, LLC settled the dayâs trade at $17.100 up 2.09%, with the market cap of ~$9.45 Bn. Its current PE multiple is at 20.210x, dividend yield is at 2.51% and its last EPS was noted at $0.829. Its 52 weeks high and 52 weeks low stand at $20.490 and $11.030, respectively, with an annual average volume of 2,449,355. It has generated an absolute return of -15.45% for the last one year, 24.54% for the last six months, and 22.00% for the last three months.
Disclaimer
This website is a service of Kalkine Media Pty. Ltd. A.C.N. 629 651 672. The website has been prepared for informational purposes only and is not intended to be used as a complete source of information on any particular company. Kalkine Media does not in any way endorse or recommend individuals, products or services that may be discussed on this site. Our publications are NOT a solicitation or recommendation to buy, sell or hold. We are neither licensed nor qualified to provide investment advice.
