


Australian health care sector being a lucrative sector with strong growth potential has gained enormous spotlight from investors, despite global trade concerns. Hence, irrespective of market volatility, investors and stockholders cherry-pick best health stocks to pour their cash in.
Nevertheless, investors need to be cautious while selecting stocks and need to keep an eye on various factors which include companyâs stock performance, financials, revenue model, market cap, profits earned, share buyback and P/E ratio.
Precisely for health care stocks, other factors contributing to investorsâ decision include vigilance on clinical progress, regulatory approvals, future growth strategy, demographic trends of the ageing population, funding grants by government bodies and rise in chronic diseases, to name a few.
In this article we will be zooming a lens on four ASX-listed health care stocks with varied P/E ratio.
Price-earnings ratio, referred to as the P/E ratio, reflects the amount that investors are ready to pay for each dollar of earning. It is the ratio used during the valuation of a company, which is calculated by dividing the sharesâ current market price by its earnings per share (EPS). P/E ratio is the most commonly employed tool for selection of stocks.
P/E Ratio = Shares Market Price/EPS
P/E Ratio determines the value of a stock. A high P/E ratio signals an over-valued stock or else it could mean investors are anticipating high growth rates in the future and the companyâs with nor earning have no P/E ratio.
It is important to note that a complete picture of a company should be considered before selecting as no single parameter can determine whether a stock is a value or not.
Letâs dive straight into each of these stocks and look at their overall performance.
Summerset Group Holdings Limited
Summerset Group Holdings Limited is a dual listed company on NZX and ASX (ASX: SNZ) and is one of the largest retirement village operators in New Zealand. With its first village opened in 1997 and regarded as fastest growing retirement village operator in the country. Summerset has a total of 28 villages, either completed or in the development phase across NZ.
Summerset Expanding Further Buys Land in Prebbleton
In its latest announcement dated 27 November 2019, the company informed that it had bought land for a new retirement village in Prebbleton, Selwyn District, southwest of Christchurch; 4th Christchurch Village. Summersetâs new village would include ~290 homes, including 2&3-bedroom villas, flats, serviced apartments, rest home & hospital level care and in addition, the purpose-built Memory Care Centre dementia patients.
The number of people aged more than 75 is estimated to rise by 80% in the next ten years in the Prebbleton catchment area with the current 75+ population of around 4,300 people.
It was further informed that, the new retirement village would be constructed on the currently existing mushroom processing plant site, which is expected to exit by mid-2020. The existing buildings would be removed, and the site would be remediated before the constriction of village begins.
The Company estimated a total investment in the village construction to surpass NZ$150 million and during the building phase, over 300 people will be employed. Further, in future, upon village opening, up to 70 additional permanent jobs will be created. Opening date is yet to be determined however, design and consenting work would start immediately.
Summerset Receives Green Signal for St Johns Village
In another ASX announcement, SNZ updated that it has received go ahead signal for its retirement village (in St Johns). In Auckland region, Summerset presently is operating 5 villages, with another 2 villages currently under planning in Milldale and Parnel.
In the first half of financial year 2019, the company announced a profit of NZ$47.8 million (underlying).
On the stock front, on 6 December 2019, SNZâs shares traded flat at $7.32 with a market cap of $1.66 bn and 226.83 million outstanding shares. The 52 weeks high of the stock was noted at $7.48. The P/E ratio of the company stood at 7.47x with an EPS of $0.980.
Healius Limited (ASX: HLS)
A leading health care entity with a wide network consisting of multi-disciplinary medical centres, diagnostic imaging centers and pathology laboratories Healius Limited (ASX: HLS) offers world-class services to the radiologists, general practitioners and other health care specialists delivering quality care to the patients.
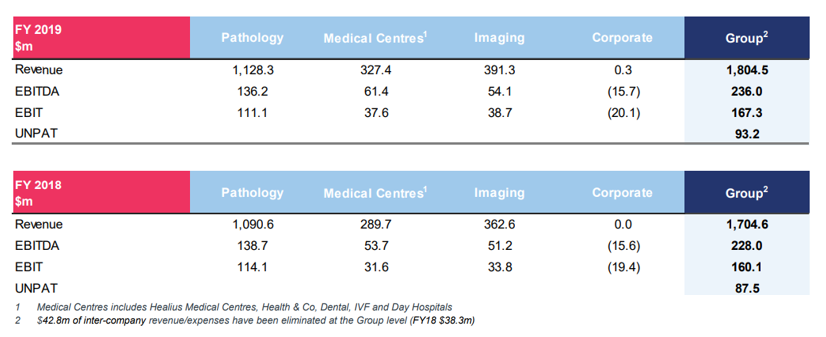
Underlying Financial Highlights from 2019 AGM Presentation
- The Company generated revenue amounting to $1,804.5m for FY2019 in comparison to $ 1,704.6m for the FY 2018.
- EBITDA was reported at $0m for FY2019 as compared to $228.0m for FY2018.
- EBIT noted at $167.3m for FY2019 while for FY2018 the underlying EBIT noted at $160.1m.
- UNPAT for FY2019 amounted to $93.2 while for FY2018 it was noted at $87.5
Financial performance from each segment is depicted in the figure below-
- Reported a net debt of $678m
- Reported final dividends at 3.4 cents per share and total dividend at 7.2 cents per share
Healius Strategic Projects
Healiusâ is presently engaged in four transformational projects that are unlikely to be undertaken again at such a collective magnitude:
- Leapfrog â Medical Centres transformation program with total Opex (adjusted between reported and underlying) of $3.1m and total Capex at $31.6m.
- Laboratory Platforms with a total Opex of $10.3m and total Capex at $4.2m
- Corporate infrastructure renewal program with total Opex of $9.2m
- iCAR with total Opex at $3.1m and total Capex at 5.0m
It was further revealed that, iCAR is expected to conclude after FY 2020, Leapfrog and corporate infrastructure renewal program are expected to considerably decrease after FY 2020. Further informed that LIS in Pathology is a 5-year project.
On the stock front, HLSâs shares traded at $2.92, up 0.69% on 06 December 2019, with a market cap of $1.81 bn and 622.74 million outstanding shares. The 52-week high of the stock was noted at $3.315. The P/E ratio of the company stood at 31.52x with an EPS of $0.092.
ProMedicus Limited (ASX:PME) is a leading pharmaceutical company that is focused on providing medical imaging products to health care firms, imaging centers and clinics. Visage Imaging is the Pro medicusâ wholly-owned subsidiaries which comprises-
- Visage RIS
- Visage RIS/PACS
- Visage 7
- Visage Ease ProTM
- Visage EaseSM technologies
ProMedicusâ leading Visage7 Platform remains to be on top in terms of speed, functionality and scalability.
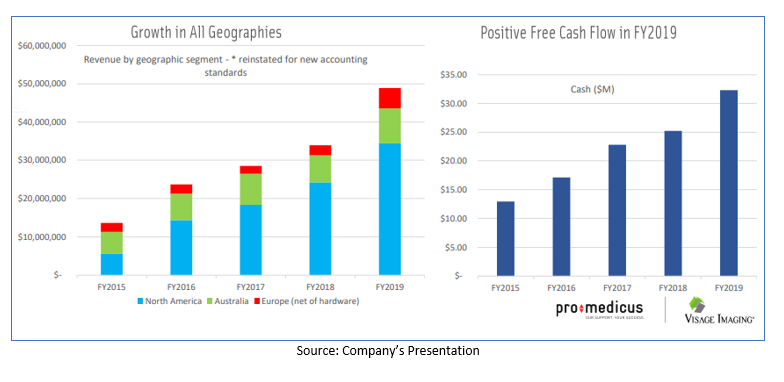
Financial Highlights from 2019 AGM Presentation
- Reported revenue amounted to $50.1m for FY2019, up 48% on a YoY basis when compared to $33.87m for FY2018.
- Profit Before Tax reported to be $26.12m for FY2019, increased 71% as compared to $ 15.30m for FY2018.
- Net profit after tax was recorded at $19.13m for FY2019, reflecting an increase of 92% on $9.97m for FY2018.
- Cash reserves for FY2019 was reported at $32.32, an increase of 28% from $25.24 for FY2018.
- Earnings per Share (cps) were noted at 18.5 for FY2019, up 91% from $9.7 for FY2018.
Recently, Pro Medicusâ wholly-owned U.S. subsidiary, Visage Imaging, Inc., showcased the Visage AI Accelerator solution & the new Visage created breast density classification algorithm at the Radiological Society of North America (RSNA) conference, held on 1-5 December 2019.
On the stock front, PMEâs shares traded at $23.27, down 5.25% on 06 December 2019, with a market cap of $2.55 bn and 103.98 million outstanding shares. The 52-week high of the stock was noted at $38.39. The P/E ratio of the company stood at 132.7x with an EPS of $0.185.
ResMed (ASX:RMD) focuses on innovative solutions, develops cloud-connected superior quality medical devices to provide a top-quality and healthier life to patients diagnosed with sleep apnoea, chronic obstructive pulmonary disease (COPD), and other chronic ailments.
Financial Highlights for the Quarter Ended 30 September 2019 (First Quarter 2020 or Q12020)
The company reported significant progress during Q12020 with double-digit revenue growth and a balanced growth across its product portfolio and global businesses.
- Generated a revenue of $681.1 million representing an increase of 16%.
- Non-GAAP operating profit rose by 22%.
- Net operating profit of the company grew by 19%
- GAAP diluted earnings per share (EPS) noted at $0.83 and non-GAAP diluted earnings per share noted at $0.93
On the stock front, RMDâs Shares settled for the day at $22.07 on 06 December 2019, up 0.91%, with a market cap of $31.35 billion and 1.43 billion outstanding shares. The 52-week high of the stock was noted at $22.30 and P/E ratio stood at $54.25 with EPS $0.403.
Disclaimer
This website is a service of Kalkine Media Pty. Ltd. A.C.N. 629 651 672. The website has been prepared for informational purposes only and is not intended to be used as a complete source of information on any particular company. Kalkine Media does not in any way endorse or recommend individuals, products or services that may be discussed on this site. Our publications are NOT a solicitation or recommendation to buy, sell or hold. We are neither licensed nor qualified to provide investment advice.
