


Introduction:
Five important Australian stocks from different sectors (logistics, financial services, aviation and furniture retailing industry) with different market capitalizations, are Eclipx Group Limited (ASX:ECX), Xero Limited (ASX:XRO), Qube Holdings Limited (ASX:QUB), Temple & Webster Group Ltd (ASX:TPW) and Virgin Australia Holdings Limited (ASX:VAH). Letâs see how the recent updates are impacting their stock prices.
Eclipx Group Limited (ASX:ECX)
Eclipx Group Limited (ASX:ECX) is involved in providing corporate and consumer asset backed financial services, complete fleet management services, online auctioneering and associated services, and medium -term vehicle rental services in the Australian and New Zealand markets.
Recently, Mitsubishi UFJ Financial Group, Inc. became substantial holder to the company with a stake of 5.06%, effective from September 16, 2019. In another announcement, ECX informed the market that it will provide details of the amended corporate debt facilities at its strategy update scheduled on September 24, 2019. Strategy update will also include details on Eclipxâs non-core business divestment program;; cost optimisation plan; and core business strategic initiatives.
H1FY19 Key Highlights: Net operating income for the period ending on 31st March 2019, was reported at $132.0 Mn, which is a decline of 15% on previous corresponding period. Earnings before Interest, Tax, Depreciation, Amortisation and one-off costs (including goodwill impairment) (EBITDA) for the period was reported at $31.3 Mn, which is a decline of 46% on previous corresponding period. Net Profit After Tax & Amortisation (NPATA) for the period was reported at $13.8 Mn, which is a decline of 62% on previous corresponding period.
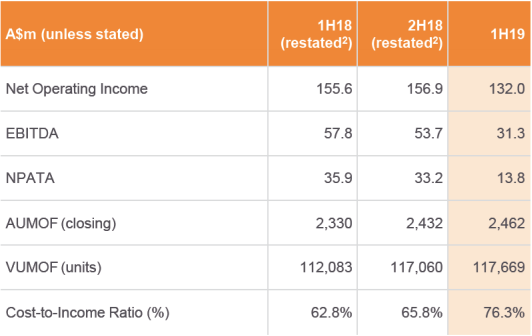
H1FY19 Key Metrics (Source: Companyâs Report)
On the stock information front
On September 23,2019, Eclipx Group Ltd settled the dayâs trade at $1.810 up 5.848%, with market cap of ~$546.58 Mn and annual dividend yield of 9.36%. Its 52 weeks high and 52 weeks low stand at $2.820 and $0.540, respectively, with an annual average daily volume of 3,153,959. It has generated an absolute return of -30.20% for the last one year, 106.02% for the last six months, and 34.65% for the last three months.
Xero Limited (ASX:XRO)
Xero Limited (ASX:XRO) provides financial record keeping through cloud- based accounting software, with full spectrum of tools and services that can help small businesses to succeed. In its annual meeting for 2019, the management highlighted that in the past four years the company has made first ever positive free cash flow of NZD 6.5 Mn in FY19 ended on 31st March 2019, which is equal to 1.2% of its operating revenues. It witnessed 31% growth in its subscriber numbers over FY18, which reflects businessâs continued strong traction with progress in the international markets. During the year, a net of 432,000 subscribers joined the company taking the overall subscriber numbers to more than 1.8 Mn. Operating revenue for the period increased by 36% to NZD 552.8 Mn, and the EBITDA (excluding the impact of impairments) increased by NZD42.0 Mn to NZD91.8 Mn.
Lifetime Value (LTV) per subscriber in the period climbed by 3% to NZD2,398, which was driven by a move up in both ARPU and gross margin with consistent churn trends. The total lifetime value added in the period was reported at ~NZD1.1 billion, which resulted into increase in total lifetime value by 36% on the prior year. Reported EBITDA for the period increased by 52% to NZD73.2 Mn, including impairment charges of NZD18.6 Mn and exclusion of acquisition related costs of NZD 1.3 million. After exclusion of share-based payments and impairment charges, EBITDA improved by NZD54 Mn to NZD120.7 Mn (which is an increase of 81% on Y-o-Y basis). EBITDA margin, excluding share-based payments and impairments, improved by 5 percentage points over the year-ago period to 22%.
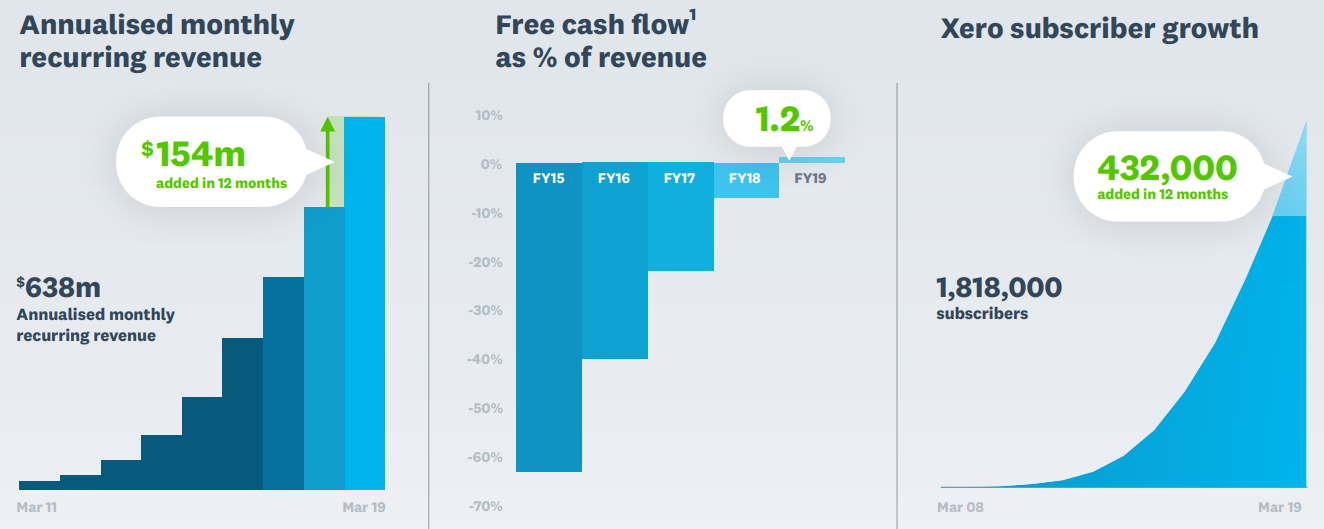
XRO Key Financial Metrics (Source: Companyâs Report)
On the stock information front
On September 23, 2019, Xero Limited settled the dayâs trade at $65.640 up 2.884%, with the market cap of ~$9.02 Bn. Its 52 weeks high and 52 weeks low stand at $68.880 and $36.100, respectively, with an annual average daily volume of 396,806. It has generated an absolute return of 34.01% for the last one year, 27.60% for the last six months, and 1.92% for the last three months.
Qube Holdings Limited (ASX:QUB)
Qube Holdings Limited (ASX:QUB) is involved in providing comprehensive logistics solutions across multiple nodes of import-export supply chain. Moreover, the group is engagement in the management, development and operation of strategic properties with future development potential into logistics facilities. On September 16, 2019, the company informed the market about the issuance of 5,495,409 additional securities at $3.1530 per share.
In another update, Qube Logistics (Aust) Pty Ltd (Qube BidCo), a wholly owned subsidiary of Qube Holdings Limited (Qube), confirmed completion of acquisition of Chalmers Limited. Resultantly, Qube through Qube BidCo now has full stake (100%) in Chalmers.
Key Highlights for the FY19, ended on 30th June 2019: Underlying NPAT attributable to Qube increased by 15.4% to $123.2 Mn. Underlying revenue rose by 4.7% to $1.73 Bn. Statutory NPAT attributable to Qube for the period was reported at $196.6 Mn. Full year dividend (fully franked) was reported at 6.7 cps. The final dividend increased by 3.6% to 2.9 cents per share.
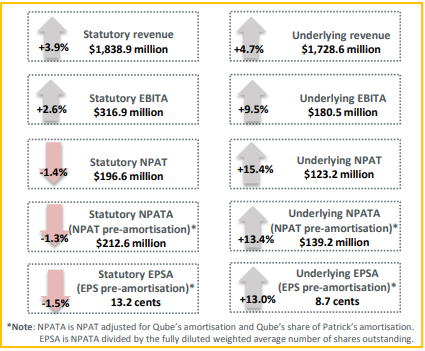
QUB FY19 Key Financial Metrics (Source: Companyâs Report)
On the stock information front
On September 23, 2019, Qube Holdings Ltd settled the dayâs trade at $3.150 down 0.943%, with the market cap of ~$5.17 Bn. Its annual dividend yield stands at 1.79%, and PE multiple stands at 25.850X. Its 52 weeks high and 52 weeks low stand at $3.340 and $2.312, respectively, with an annual average daily volume of 3,272,572. It has generated an absolute return of 24.19% for the last one year, 16.06% for the last six months, and 2.25% for the last three months.
Temple & Webster Group Ltd (ASX:TPW)
Temple & Webster Group Ltd (ASX:TPW) is a leading online retailer of furniture and homewares in Australia. The company has over 150,000 products on sale from over 100 suppliers. Its business model involves an innovative drop-shipping model, where products are sent directly to customers by suppliers, enabling a larger product range, faster delivery times and reducing the need to hold inventory. On September 18, 2019, the company informed the market about the issuance of 42,048 Ordinary Sharesto 74 employees under the Temple & Webster Group Ltd Employee Share Plan ($1,000 Tax Exempt), having a lock in period till 18th September 2022 In another announcement on August 30, 2019, the company announced a sale of 1.3 Mn shares by CEO, Mark Coulter. The main purpose of this development was to cover tax obligations. Mr. Coulter continues to hold interest in 10.2 Mn shares / options.
Key Highlights for the FY19, ended on 30th June 2019: Revenue for the period increased by 41% to $101.6 Mn. EBITDA for the period was reported at $1.1 Mn, as compared to a loss of $0.7 Mn in the previous corresponding period. Cash balance at the end of the period was reported at $13.5 Mn with no debt.
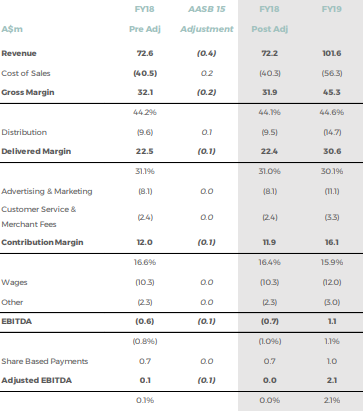
FY19 Income Statement (Source: Companyâs Report)
On the stock information front
On September 23, 2019, Temple & Webster Group Ltd settled the dayâs trade at $1.900 up 6.443%, with the market cap of ~$201.33 Mn. Its PE multiple stands at 52.970X. Its 52 weeks high and 52 weeks low stand at $1.900 and $0.930, respectively, with an annual average daily volume of 107,873. It has generated an absolute return of 76.73% for the last one year, 27.50% for the last six months, and 32.22% for the last three months.
Virgin Australia Holdings Limited (ASX:VAH)
Virgin Australia Holdings Limited (ASX:VAH) is into domestic and international passenger and cargo airline businesses. It offers variety of aviation products and services to the Australian market including corporate, government, leisure, low cost, regional and charter travellers and air freight customers.
Key Highlights for the FY19, ended on 30th June 2019: : Underlying loss before tax for the period was reported at $71.2 Mn, reflecting the impact of adverse H2FY19 market conditions, new-route investments and $158.8 Mn in fuel and foreign exchange headwinds. Statutory loss after tax for the period was reported at $315.4 Mn, which is inclusive of non-cash impairment of Tigerair and VA international business units, derecognition of deferred tax assets and restructure costs. Despite deterioration in revenue and trading conditions in H2FY19, total revenue for the period increased by 7.6% to $5.8 Bn. Cash balance at the end of the period was reported at $1.7 Bn.
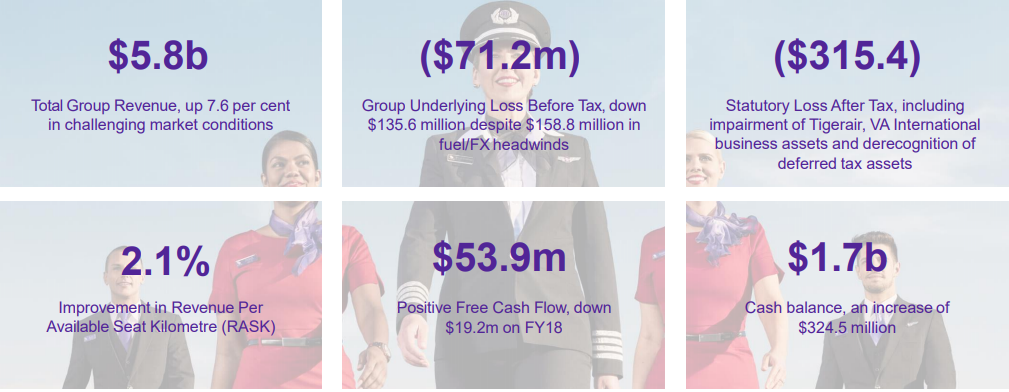
FY19 Key Financial Metrics (Source: Companyâs Report)
On the stock information front
On September 23, 2019, Virgin Australia Holdings Limited settled the dayâs trade at $0.165 up 3.125%, with the market cap of ~$1.35 Bn. Its 52 weeks high and 52 weeks low stand at $0.230 and $0.150, respectively, with an annual average daily volume of 524,920. It has generated an absolute return of -28.89% for the last one year, -15.79% for the last six months, and -5.88% for the last three months.
Disclaimer
This website is a service of Kalkine Media Pty. Ltd. A.C.N. 629 651 672. The website has been prepared for informational purposes only and is not intended to be used as a complete source of information on any particular company. Kalkine Media does not in any way endorse or recommend individuals, products or services that may be discussed on this site. Our publications are NOT a solicitation or recommendation to buy, sell or hold. We are neither licensed nor qualified to provide investment advice.
