


Crude oil prices significantly reflect the level of global economic activities; while high crude oil prices are inflationary, a fall in oil prices is considered as deflationary.
Crude Oil and Inflation Expectation
Crude oil contributes significantly in the energy sector, and the energy sector plays a major role in an economy. The petroleum products stand as a primary variable cost for businesses, and higher crude oil prices increase the cost of petroleum products, which in a loop, increases the cost of the good sold and hence exhibit the inflationary effect.
The recent plunge in crude oil prices before the attack on Saudi Arabiaâs Aramco reduced the market inflation expectations, which could be further corroborated by the decline in the yield difference between the five-year Treasury rate and five-year Treasury Inflation-Protected Securities (TIPS).
The spread between the yields of five-year Treasury rate and five-year Treasury Inflation-Protected Securities descended from the 1.47 per cent (as on 01 August 2019) to 1.35 per cent (as on 05 September 2019).
Thus, a low crude oil price lends to lower inflation expectation, which in turn, prompts the central banks to decrease the interest rate.
Also Read: Aramco Fire Fuelled ASX Energy Stocks; United States SPR to Rebalance the Supply Chain?
Crude Oil as an Indicator
Lower economic activity is generally associated with the lower crude oil prices and vice versa. Crude oil contributes significantly to the economy, and when the market expects lower economic growth, it discounts the crude oil prices as crude oil consumption under lower economic growth scenario is bound to be lower.
Some market participants use the crude-to-gold ratio to reckon the global economic condition. A higher crude-to-gold ratio indicates a high market expectation of growth and vice versa. Crude oil prices can be used as a benchmark for many other activities as well.
Advantage and Disadvantage of Surging Oil Prices
- The higher crude oil prices demonstrate a market expectation of higher economic growth.
- The rise in crude oil prices shows higher economic activity.
However, if the prices reach above a threshold level, which an economy can take, it could lead to inflation and make the end-user products such as fight fares, petroleum products, energy fares, high, which in turn, could impact the economic conditions depending upon the quality of employment in an economy.
Current Market Behaviour of Crude Oil
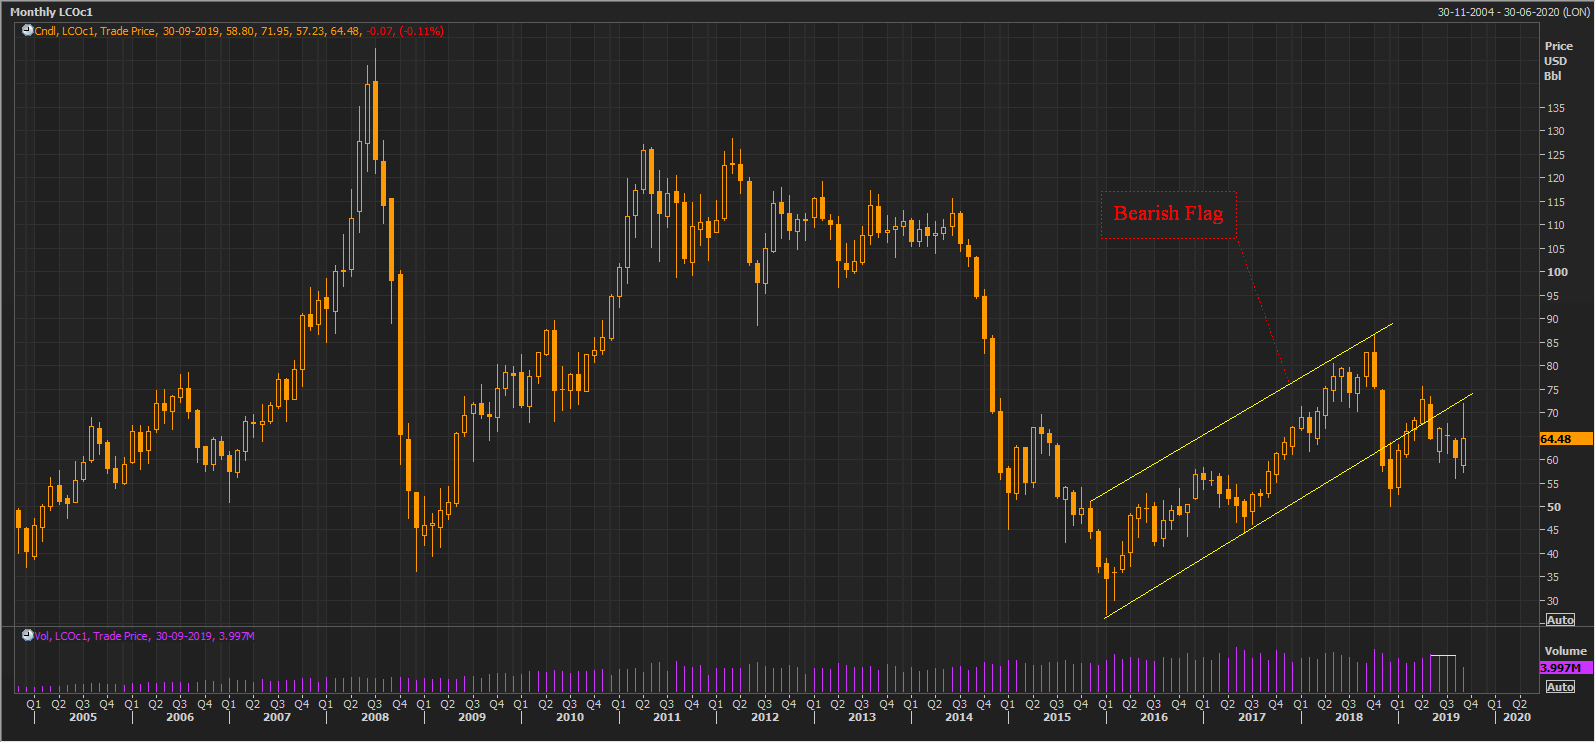 LCO Monthly Chart (Source: Thomson Reuters)
On a monthly chart, the crude oil prices have formed a bearish flag pattern (bearish signal). In the recent months, the crude oil prices rose to retest the breakout levels, where the sellers took charge, and the prices again dropped.
During the retesting of the breakout levels, the volume remained lower against the volumes, when prices breached the lower band of the flag to give a breakout, which in turn, suggests lower interest from bulls or we can say bulls failed to keep the prices above the lower band of the bearish flag.
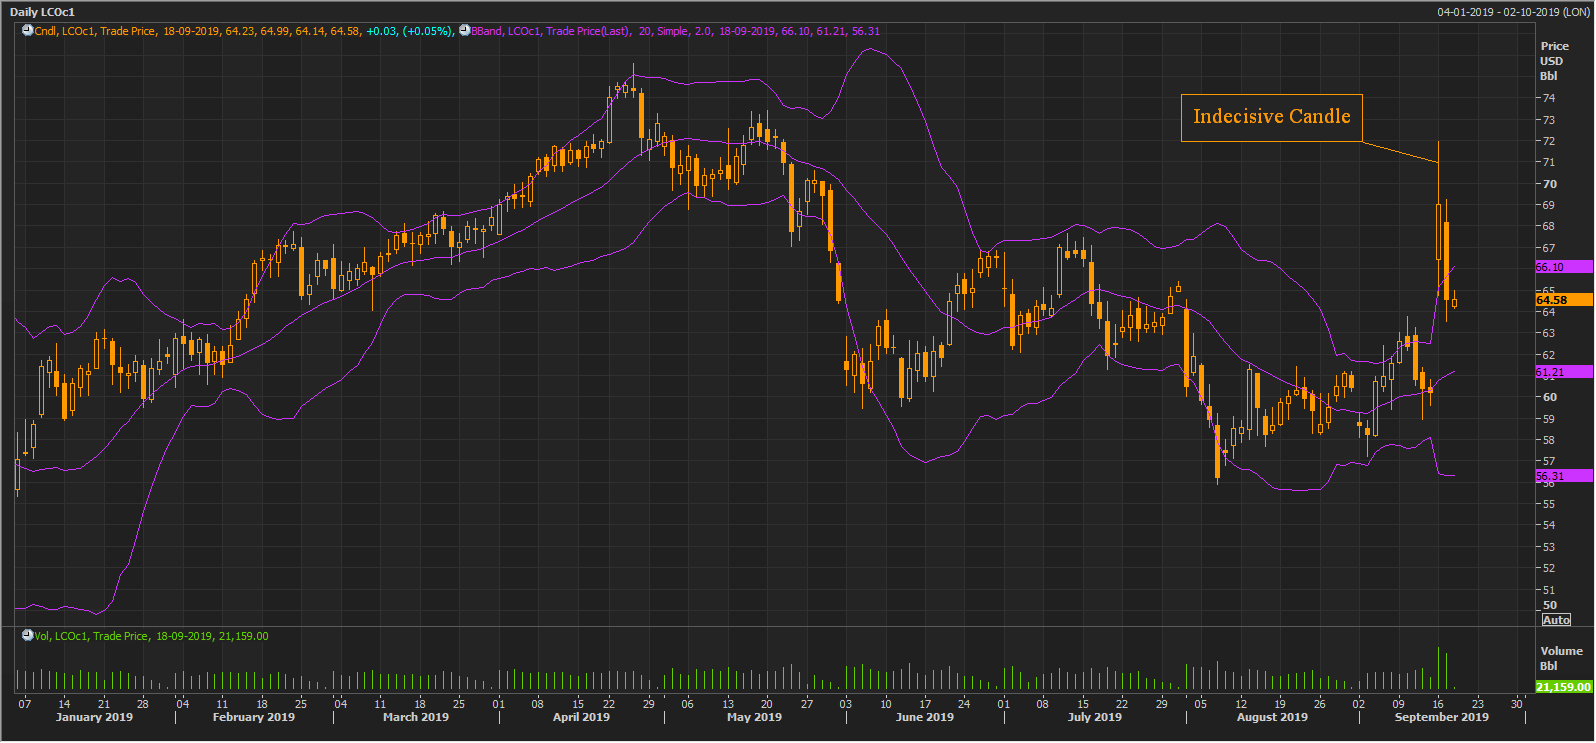 LCO Daily Chart (Source: Thomson Reuters)
On the daily chart, the crude oil prices have been in a down trend for quite some time. However, prices recovered slightly post the drone attack on the oil processing facilities of the Saudi oil giant-Aramco. Post the event, the prices crossed the upper line of the 20-day simple Bollinger band and formed an indecisive candle pattern (long shadows, with price closing at ~50% of its total price action of the day)
The crude oil prices traded much lower on the second day after forming the indecisive candle pattern on 16 September 2019 and crossed its previous dayâs low, which in turn, indicated bears strength in the market.
The crude oil prices are now trading below the upper line of the Bollinger, which could act as a near-term resistance for the prices, and the median of the band could act as the support for the prices in the short-term.
What to Expect Ahead?
 LCO Daily Chart (Source: Thomson Reuters)
On the daily chart, the Span A (the mean of the conversion and base line) of the Ichimoku is moving above the Span B (the mean of 52 days high and low), which in turn, suggests a chance of a trend reversal. The Span A is at US$65.01, and the Span B is at US$63.92.
The spread between Span A and Span B is narrowing down, which is supporting the chances of the trend reversal.
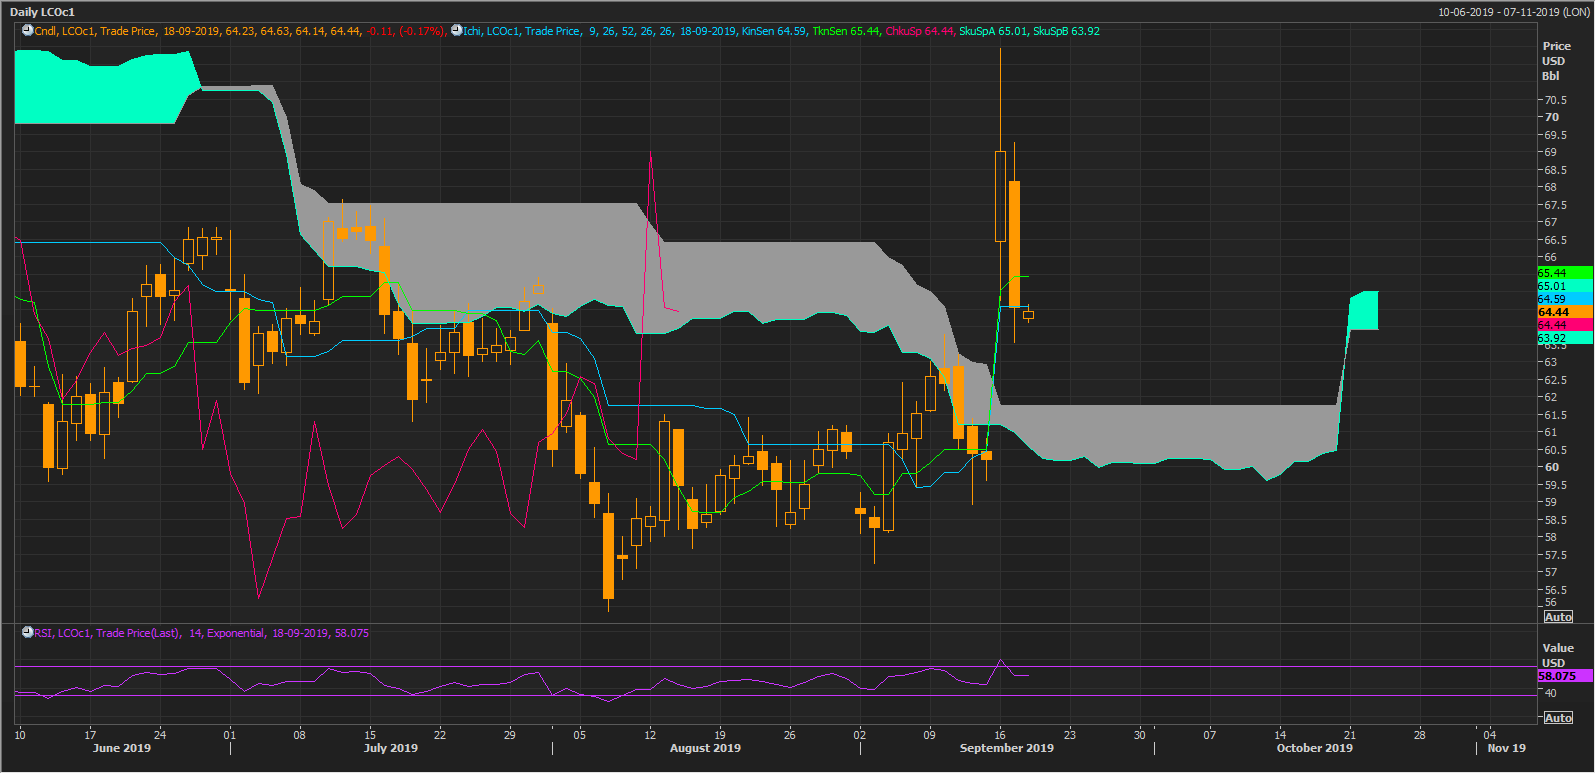 LCO Daily Chart (Source: Thomson Reuters)
The conversion line (the mean of 9 days high and low) is trading above the base line (the mean of 26 days high and low), which in turn, signifies a positive crossover of the Ichimoku. The conversion line is at US$65.44, and the base line is at US$64.59.
The positive crossover of the conversion and base line is above the cloud where Span A is below Span B, which in turn, suggest that the crossover is not very strong; however, still bullish in depiction.
The 14 days Relative Strength Index is also trailing high, which in turn, further supports the crossover of the conversion and base line.
In a nutshell, the crude oil prices are showing early signs of a trend reversal, and the light black cloud could provide short-term support to the crude oil prices.
While the Ichimoku clouding technique is indicating chances of a trend reversal for a short-term, one cannot ignore the EIA recent forecast, which did not sound very optimistic. The current global economic conditions are not very supportive for crude over the mid-term amid slower activities across the globe and falling manufacturing indices.
To Know More, Do Read: EIA Forecast Brings More Shock Waves For ASX-listed Oil & Gas Explorers
The global stance to shift towards zero-emission in line with the Euro 6 standards is also shifting many energy investors toward the alternative energy sector, which includes, nuclear, coal, renewable, etc. Recently, the market had witnessed a rise in prices of commodity used in alternative energy sector such as uranium, coal, silver, etc., which in turn, suggest that the current fluctuation in the oil market coupled with global stance to bring emission under control is shifting the investors toward alternative energy sources, which is also a risk for crude oil over the long-run.
To Know More, Do Read: ASX-Listed Alternative Energy Stocks Under Investorsâ Lens as Oil Risk Surmounts
Disclaimer
This website is a service of Kalkine Media Pty. Ltd. A.C.N. 629 651 672. The website has been prepared for informational purposes only and is not intended to be used as a complete source of information on any particular company. Kalkine Media does not in any way endorse or recommend individuals, products or services that may be discussed on this site. Our publications are NOT a solicitation or recommendation to buy, sell or hold. We are neither licensed nor qualified to provide investment advice.
