


_06_15_2026_08_31_29_563066.jpg)

With the potential to deliver remarkable profits, the lucrative Australian Health Care Sector frequently catches investorsâ attention. A multifaceted approach is essential to understand the nitty-gritty of investing in Health Care Stocks. Increasing investors interest in this sector count on multiple variables including latest developments, demographics, invention, regulatory approvals, patents, clinical trials to name a few.
In this article, we will be looking at two market players, listed on ASX - EBOS Group Limited and Fisher & Paykel Healthcare Corporation Limited, that recently created a buzz upon their latest ASX-market updates. Digging in further, let us look at each of these stocks in detail.
EBOS Group Limited (ASX: EBO)
The largest and most diversified Australasian marketer, EBOS Group Limited (ASX: EBO) is involved in wholesale & distribution of healthcare, medical and pharma products, along with consumer products and animal care brands.
With $34 million acquisition of LMT and National Surgical, EBOS enters Medical Devices Sector
Dated 15 October 2019, EBOS in its released 97th Annual Meeting presentation announced that the group has strategically acquired LMT (âLife. Movement. Technology.â) and National Surgical business (LMT/NS), which allowed its entry into the medical device sector.
This acquisition represents an important stepping stone that offers a robust platform and lays the foundation for EBOSâ Healthcare portfolio and growth into Australian and New Zealand medical devices sector worth $8 billion.
LMT/NS is engaged in offering products and services to the Orthopaedic, Neuro, ENT and so forth since last 24 years and of late to the sports medicine community as well.
Key Points to be noted
- The acquisition was priced at $34 million.
- New business is expected to generate nearly $40 million revenue.
- It is expected that this acquisition would not have any material impact on the earnings for the financial year 2020.
- The acquisition is likely to encounter EBOS return on capital employed hurdle of 15% within two years.
Highlights of EBOS Group Limitedâs Annual General Meeting
Management Changes
Effective from 15 October 2019, EBOS groupâs Director and Chairman, Mr Mark Waller retired. With effect from Mr Wallerâs retirement, the Board had appointed Liz Coutts as the new Chairperson.
Financial Summary Results for the year ended 30 June 2019
- EBOS Group reported underlying revenue of $6,930.4 for FY2019, up 0.8% as compared to $6,986.7 for the FY2018.
- EBITDA noted at $261.6 for FY2019, up 4.6% vs $250.1 for FY2018.
- NPAT was recorded at $144.4 for FY2019, increased 5.2% on $137.3 for FY2018.
- Earnings per Share reported being 94.2 cents for FY2019 with an increase of 4.4% on the EPS of 90.4 cents for FY2018.
- Declared total dividends of 71.5 cents for FY2019, there was an increase of 4.4% on total dividends of 68.5 cents for FY2018.
Strategic Investments driving shareholders returns
- EBOS group has been delivering, long-term sustainable returns for its stockholders, via strategic investments for growth and productivity, which resulted in the total shareholder annualised returns amounting to 1% over 34 years with a 1,016% increase in share price since 2001.
- In the last five years, the EBOS group invested more than $600 million. The group believes that these strategic investments are the main driving force behind the solid shareholder returns.
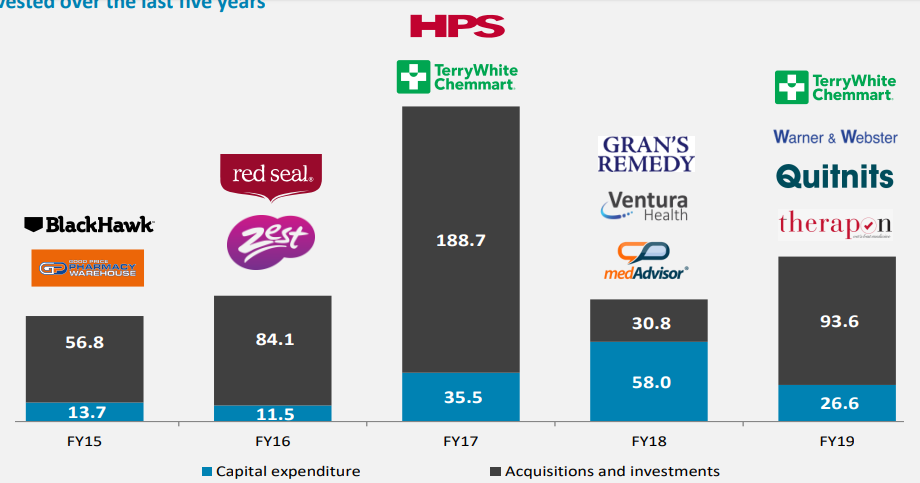
Source: Company Presentation
- In the FY2019, EBOS group invested approximately $120 million in external acquisitions, investments and capital expenditure, compared to approximately $89 million spent in FY2018, noting an increase of around 35%.
- EBOS group has also successfully raised NZ$175 million capital for a continued growth strategy.
- EBOSâ investment strategy also fetched robust growth in underlying EBITDA and EPS with a CAGR of +9.4%, and +9.5% respectively, from FY2015 to FY2019.
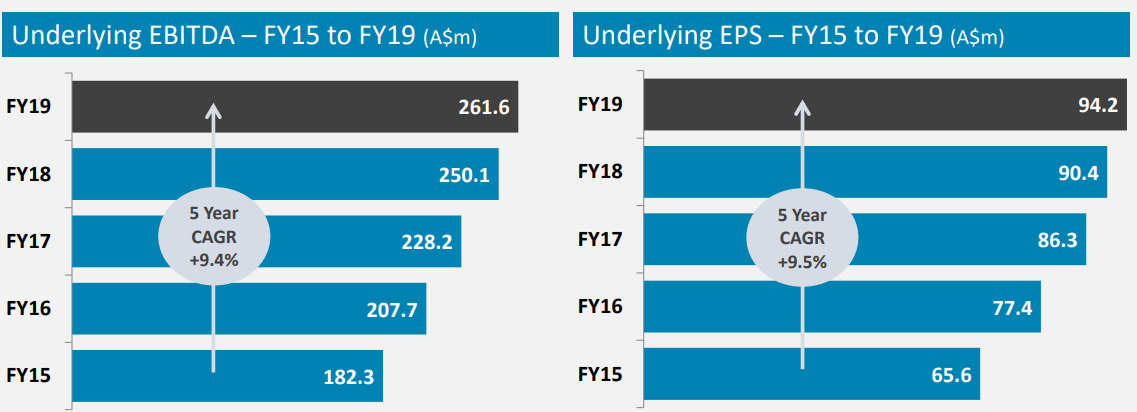
Source: Company Presentation
Strategic highlights for FY2019
Further, in Australia two main facilities were opened in the year 2019 including a new highly automated wholesale distribution centre opened at Brisbane, with operations begun in October 2018 and a new contract logistics facility opened at Sydney.
EBOS group has already completed all the preparations successfully ahead of servicing 450+ Chemist Warehouse stores on 1 July 2019.
Segment Performance for FY2019
Health Care Sector
- EBOSâ Australian revenue declined by 3.5%, though up by 5.2% while excluding sales of hepatitis C medicine and PBS price reforms.
- Primarily, growth in Institutional Healthcare and Contract Logistics resulted in a 7% rise in underlying EBITDA, which was partially offset by a subdued Wholesale Pharmacy result.
- Strong growth from all business units led to a rise of 8.7% in New Zealand revenue, with solid growth from all business units; however, the cost increase in labour and freight in the wholesale businesses impacted the earnings.
Animal Care Sector
- Increase in EBITDA by 5.7% amounting to $2.6 million, principally from revenue growth of 11.4% from Black Hawk sales.
- Increase in revenue by 1.0% amounting to $3.9 million.
- Total animal care revenue growth was +7.2%, valued $21 million, which was affected due to bypassing the wholesale channel by one of the manufacturers.
On the front of trading update, EBOS Group Limitedâs trading for the first quarter of FY2020 is in line with its core expectations and the group is confident of a substantial surge in income in the current financial year.
Stock Performance
EBOâs shares last traded on ASX at a price of $23.2 (as on 16 October 2019). The market capitalisation of EBO stood at $3.76 billion, with ~162.12 million outstanding shares. On YTD basis, the stock generated a return of 18.97%.
Fisher & Paykel Healthcare Corporation Limited (ASX: FPH)
ASX-listed leading designer, manufacturer and marketer of health care products, Fisher & Paykel Healthcare Corporation Limited (ASX:FPH) has a prime focus on respiratory care, acute care, surgery and treatment of obstructive sleep apnea (OSA).
New OSA Full Face Mask Released for Sale in USA
FPHâs recent ASX-market update on 14 October 2019 revealed that FPHâs new mask; F&P ViteraTM, for OSA, is now available for sale in the United States, which is already available in AU, CA, NZ & EU and would be available in other regions, as well on the receipt of the relevant regulatory clearances.
What is F&P ViteraTM?
A full-face mask with amalgamation of unique technologies to deliver high stability and durability to redefine the mask performance with its RollFitTM XT Seal specially designed to reduce leaks and pressure on the bridge of the nose, thus providing dynamic support. To hold and keep the mask in place throughout the night, the mask contains a stability bar.
F&P Revised and Upgraded Guidance
- Post the receipt of regulatory clearance for F&P ViteraTM mask sale in the United States, the company updated the guidance related to revenue and earnings for the fiscal year ended 31 March next year.
- As per the previous full-year guidance:
- operating revenue amounted nearly $1.17 million.
- net profit after tax amounted nearly $245 million to $255 million.
(This guidance was based on NZ:US exchange rate of 64 cents.)
- The reviewed NZ:US exchange rate of 63 cents for the rest of the year FPH expects:
- a full year operating revenue of ~ $1.19 billion and;
- net profit after tax to be around $255 million to $265 million.
Stock Performance
At the end of the trading session on 17 October 2019, FPHâs shares were at $17.67, down 1.997% compared to its last close. The market capitalisation of FPH stock stood at $10.35 billion with ~574.27 million outstanding shares. On the YTD basis, the stock generated a return of 48.89%.
Disclaimer
This website is a service of Kalkine Media Pty. Ltd. A.C.N. 629 651 672. The website has been prepared for informational purposes only and is not intended to be used as a complete source of information on any particular company. Kalkine Media does not in any way endorse or recommend individuals, products or services that may be discussed on this site. Our publications are NOT a solicitation or recommendation to buy, sell or hold. We are neither licensed nor qualified to provide investment advice.
