
 AUS
AUS
 NZ
NZ
 UK
UK
 CA
CA
 USA
USA
 IND
IND








Summary
- Global economy came to a standstill with several travel restrictions and lockdowns in place to contain the COVID-19 spread, leading to significant pressure on the price of airlines and travel-related stocks.
- In the status quo, many travel restrictions are poised to ease, which is now boosting investors sentiment around airlines stocks.
- Apart from that, lower crude oil prices are also fuelling investors’ sentiment around airlines stocks which have previously plunged significantly in the wake of lost business opportunity.
- However, in the status quo, many airlines stock on ASX such as Qantas Airways, Webjet Limited, have more than doubled from their recent low in a small period of time.
The global economy which stalled for a while with several travel restrictions and lockdowns across many countries is now witnessing slight recovery with lifting of lockdown in few countries leading to ease in the travel restrictions, and on back of this the airlines and travel-related stocks show some recovery on charts.
Apart from that, the oversupply pressure on the oil market is also propelling market sentiments over the ASX-listed travel stocks. Fuel cost, which is one of the major costs for any airline company, has witnessed a sharp decline in the price, which is further fuelling such stocks.
Also Read: OPEC Anticipates Fall in Demand for Oil- Supply Chain to Match Tune?
ASX-listed Airlines Stocks Gaining Momentum in the Market?
- Qantas Airways Limited (ASX:QAN)
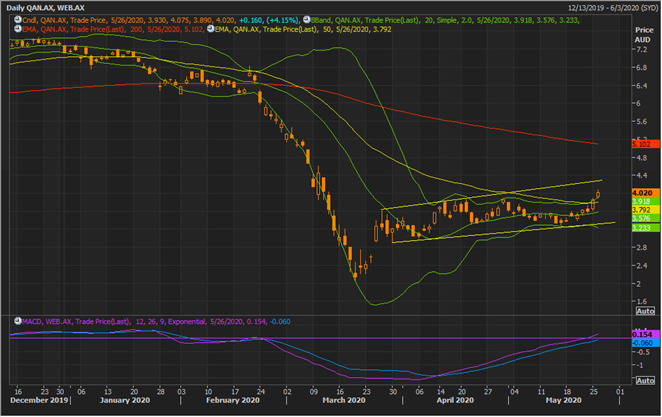
In the status quo, the stock has recovered from its recent low of $2.03 (intraday low on 19 March 2020) to the present high of $4.08 (as on 26 May 2020) to mark a price appreciation of over 100.0 per cent.
QAN Daily Chart (Source: EODHD/Others Eikon Thomson Reuters)
On the daily chart, QAN is forming a broadening wedge around the bottom and is currently moving up to test the upper line of the wedge, which should act as the immediate resistance for the stock. The stock has also given a volatility breakout with prices breaching the +1 Standard Deviation (SD) of the 20-day simple Bollinger band.
While the volatility breakout is evident, the stock needs to breach the resistance line as well to seed bullish sentiments further; however, the volatility breakout coupled with a positive signal from the 12,26,9 MACD indicator reflects on bullish momentum.
QAN is presently trading above the 50-day EMA, which should act as support in the near-term followed by +1 SD, mean value of the Bollinger, -1 SD, and at last the bottom line of the rising or ascending wedge.
Investors should closely monitor the range as a break and sustain either side of the wedge would decide further price action in it.
QAN Daily Chart (Source: EODHD/Others Eikon Thomson Reuters)
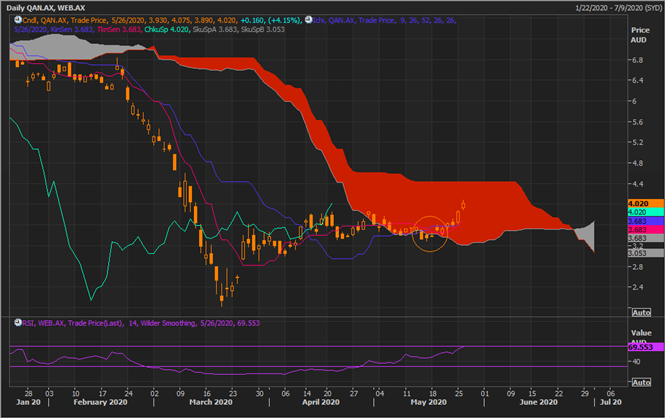
On applying the Ichimoku clouding on the daily chart, it could be seen that the price is currently showing a positive crossover between the conversion line (pink line) and the base line (dark blue line) and is currently testing the red cloud or the resistance zone for the stock, which emerged after Span A of the Ichimoku cloud slipped below the Span B.
The 14-period Relative Strength Index is currently trading above its mean value and slightly below the oversold zone, reflecting that the stock could maintain the current momentum in the near-term; however, it is yet to breach the red cloud area, which is a primary resistance and a potential point where theoretically (as per the theory of Ichimoku clouding technique) the price could reverse.
- Webjet Limited (ASX:WEB)
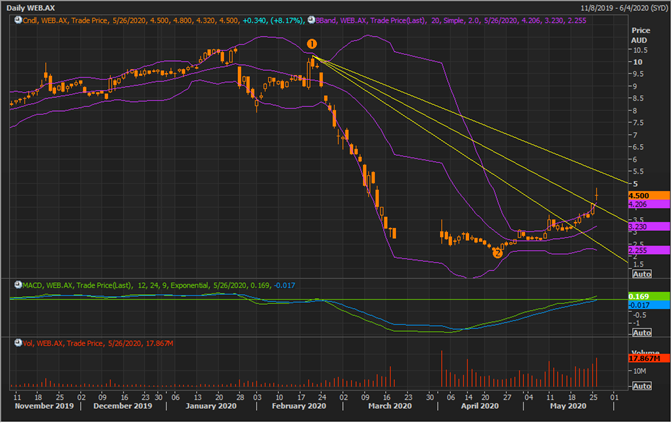
Webjet surged over improved sentiments concerning the travel ease around the globe, which underpinned a price recovery of 112.88 per cent from the level of $2.25 (intraday low on 22 April 2020) to the present high of $4.79 (as on 26 May 2020).
WEB Daily Chart (Source: EODHD/Others Eikon Thomson Reuters)
On the daily chart, it could be seen that the stock is currently trading above the 2/3 fraction of the downside projected Fibonacci fan (projected post connecting the previous high to the recent low). While the stock has breached the resistance line (2/3 fraction) of the Fibonacci, it has also given a volatility breakout with prices crossing the +1 SD of the 20-day simple Bollinger band.
Apart from that, the MACD indicator is showing a positive signal, which coupled with other observations suggest that the stock is in momentum and should face the near-term resistance above the 1/3 fraction of the Fibonacci fan, and investors should monitor the stock around that level as a break and price action above the same or failure to do so would decide further direction in it.
WEB Daily Chart (Source: EODHD/Others Eikon Thomson Reuters)
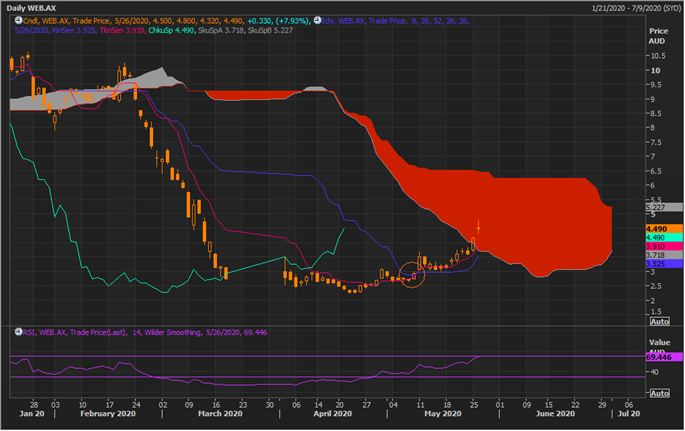
Furthermore, the stock is currently testing the resistance zone of the Ichimoku cloud or the red cloud area with a positive cross between the conversion line (pink) and the base line (blue), which coupled with an above-mean 14-period RSI reflects on the prevailing bullish sentiments.
The spread between Span A and Span B is also shortening, which is in tandem with the recent price rush; however, the same spread is yet considerably large, reflecting that the primary trend yet remains bearish in nature, and investors should monitor the price near the top line of the red cloud, as a break and sustenance above or failure to do so would decide further price action in it.
- Flight Centre Limited (ASX:FLT)
The stock which plunged to a low of $8.56 (intraday low on 23 April) in the wake of market turmoil and travel restrictions is now picking momentum with prices rising to the present high of $14.78 (intraday high on 26 May 2020) to mark a price recovery of ~ 72.66 per cent.
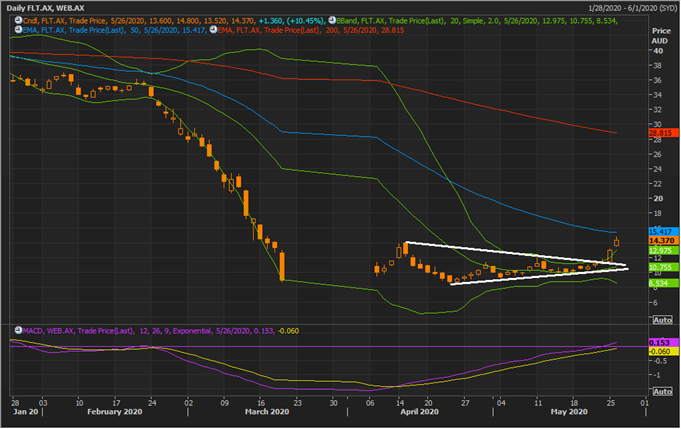
FLT Daily Chart (Source: EODHD/Others Eikon Thomson Reuters)
On the daily chart, it could be seen that the stock has given a volatility breakout, with prices breaching the +1 SD of the 20-day simple Bollinger band, along with a breakout of the narrowing triangle formation (a price pattern of consolidation), reflecting on the prevailing bullish sentiments around the stock.
However, the stock is yet trading below the 50-day EMA, which should now act as the primary resistance for the stock followed by the 200-day EMA. Investors should monitor the stock around 50-day EMA as a break and sustain above could further nurture the prevailing bullish sentiments, while failure to do so would again seed bearish sentiments.
The 12,26,9 MACD is giving a positive signal and on the downside, the +1 SD, followed by the upper line of the narrow triangle (decisive support- as the line is merging with the mean value of the Bollinger band), the second line of the triangle, and the -1 SD, should act as immediate to main support for the stock.
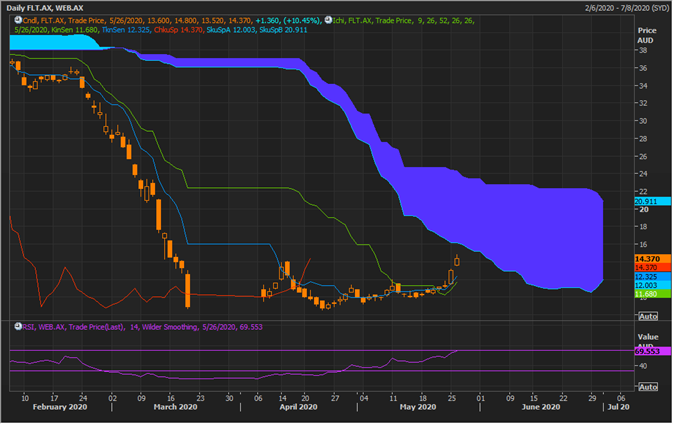
On further analysing the daily chart, it could be seen that the stock is now testing the resistance cloud, supported by the positive cross between the conversion line (blue) and the base line (green). Investors should monitor the stock at the present level as a breakout above the cloud or failure to do so would decide further price trend.
However, after observing the spread between Span A and Span B, it could be inferred that the downtrend yet remains the primary trend.
