


We are discussing five fundamentally strong companies with stable business performance. The associated stocks have generated healthy returns in the recent past. Letâs have a look at the companies.
CSL Limited
CSL Limited (ASX: CSL) is a leading biotechnology company which develops and delivers innovative medicines that save lives, protect public health and help in better recovery for people suffering with life threatening medical conditions.
On 20 September 2019, CSL informed that one of its directors named Paul Perreault has disposed 5,350 ordinary shares and his current holding stands at 128,031 ordinary shares.
Key Financial Highlights for financial year ended June 30, 2019: CSL announced its FY19 results wherein, the company posted revenue at constant currency of US$ 8,757 million, up 11% year over year while NPAT stood at US$ 2,015 million, up 17% y-o-y. The company reported gross profit at US$ 4,896 million, up 12% y-o-y. The company reported gross margin and EBIT margin at 55.9% and 29.4%, respectively during the period.
The company announced an unfranked dividend of USD 1for each ordinary share, payable on 11 October 2019.The annualized dividend yield of the stock is at 1.12%.
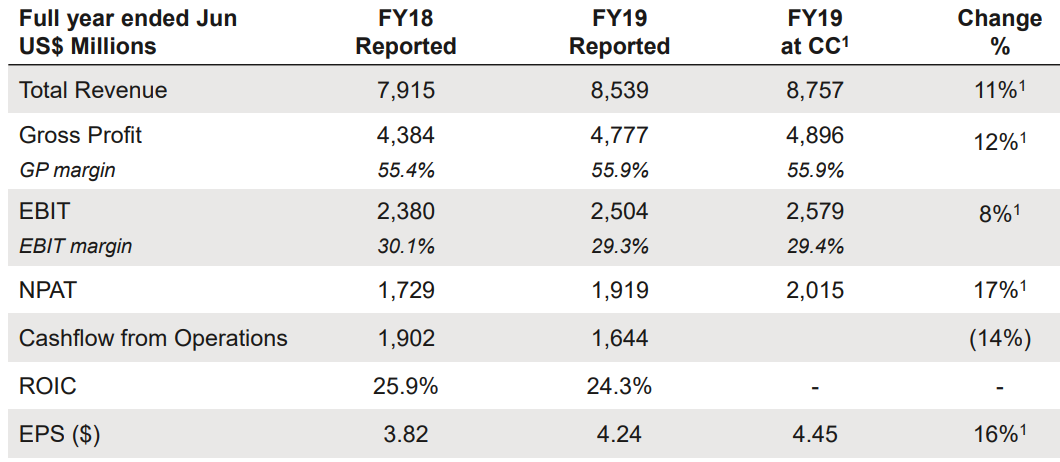
FY19 Financial Highlights (Source: Company Reports)
Outlook: The management expects strong demand for plasma and recombinant products in FY20, while it expects marginal improvement in the plasma segment. CSL expects Seqirus to deliver inline results and likely to benefit from product differentiation and process improvement. While the Management expects revenue to grow at 6% during FY20 and the NPAT is projected between US$2,050 million to US$2,110 million, higher by ~7-10% from FY19.
Stock Update: The stock of CSL was trading at $233.890 on 26 September 2019 (AEST 01:52 PM) with a market capitalisation of $107.42 billion. The 52-week trading range of the stock stood at $173 to $242.1 and currently, the stock is trading at the higher end of its 52-week trading range. The stock has generated decent returns of 10.41% and 21.19% in the last three-months and six-months, respectively.
Afterpay Touch Group Limited
Afterpay Touch Group Limited (ASX:APT) is engaged in providing technology-driven payments solutions. APT consists of the Afterpay and Pay Now services for businesses.
Key Financial Highlights for the financial year ended 30 June 2019: The company reported underlying sales at $5.2 billion, up 140% y-o-y, while revenue came in at $264.1 million from $142.3 million in FY18. The company reported loss after tax of $43.8 million as compared to a loss of $9 million in previous financial year.
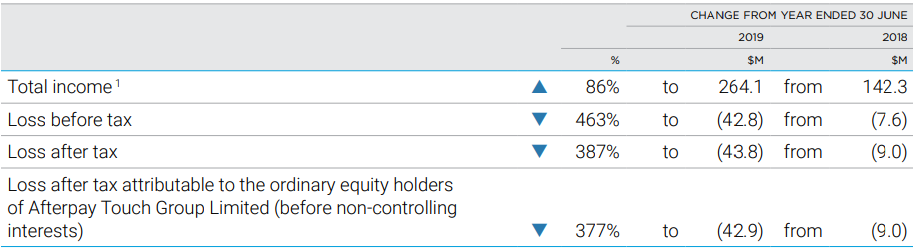
FY19 Financial Highlights (Source: Company Reports)
The company reported active customers at 4.6 million at the end of FY19, up 130% y-o-y; currently on-boarding stood at 12,500 new customers per day. US and UK witnessed growth which was better than previous estimates aided by major new merchant brands continue to on-board. The Management expects future expansion and platform innovation in the US on account of strategic partnership with VISA. Underlying free cash flow for the financial year FY19 stood at $33.3 million indicating a high return on capital employed (ROCE) business model.
Stock Update: The stock of APT was trading at $35.500 with a market capitalisation of $9.09 billion on 26 September 2019 (AEST 01:54 PM). The stock is trading at the upper end of its 52-week trading range of $10.36 to $37.120. The stock has generated stellar return of 39.97% and 84.14% in the last three-months and six-months, respectively.
Nearmap Ltd.
Nearmap Ltd (ASX: NEA) operates in online aerial photomapping and conducts its business through its subsidiaries Nearmap Australia Pty Ltd, Nearmap US Inc. and Nearmap Remote Sensing US Inc.
Recently, with a market update NEA informed about change in interest of its director Peter James where, he has acquired 1,500,000 Fully Paid Ordinary Shares at $0.551/Share and disposed 400,000 Fully Paid Ordinary Shares at $2.68 per Share
FY19 Financial Highlights for the year ended 30 June 2019: NEA announced its full year financial report, wherein the company reported 45% increase in revenue at $77.642 million and net loss of $14.93 million, increased 35% y-o-y. Employee benefits expense during the year stood at $36.84 million as compared to $31 million in the previous year.
The company reported cash and cash equivalents at $75.91 million, total assets at $158 million and net assets at $87.65 million as on 30 June 2019. During the year, NEA made product and content expansion such as the roll out of 3D Online. Moreover, the company launched an Artificial Intelligence product (beta version). Again, NEA conducted capture program expansion including the first capture of Canadian content, covering 64% of the population. Cash costs of capture were higher by 22% on prior year basis.

FY19 Financial Highlights (Source: Company Reports)
Stock Update: On 26 September 2019 (AEST 01:56 PM), the stock of NEA was trading at $2.550 with a market capitalisation of $1.14 billion. The stock has generated negative return of -33.42% and -4.53% in the last three-months and six-months, respectively.
REA Group Ltd
REA Group Ltd (ASX: REA) owns and leases various properties across the U.S., Europe, Australia and Asia which are utilized in the conduct of the companyâs businesses.
Recently, REA notified that one of the companyâs director named Tracey Fellows disposed off 9,100 ordinary shares at a consideration of $956,428. The total number of ordinary shares held by Tracey s after the disposal is 7,386.
Key Performance Highlights for the year ended 30 June 2019: REA announced its full year financial report, wherein the company reported 8% y-o-y growth in revenue of $874.9 million and NPAT of $295.5 million, up 6% y-o-y. Revenue from Australia segment grew by 9% at $799.3 million as compared to $734.1 million in the previous year. EBITDA margin stood at 57%, with no change from previous year. The business reported 8% decline in Australian national listings, including 18% in Sydney and 11% in Melbourne. The company reported growth in Commercial and Developer revenue despite the slowdown in dwelling commencements.
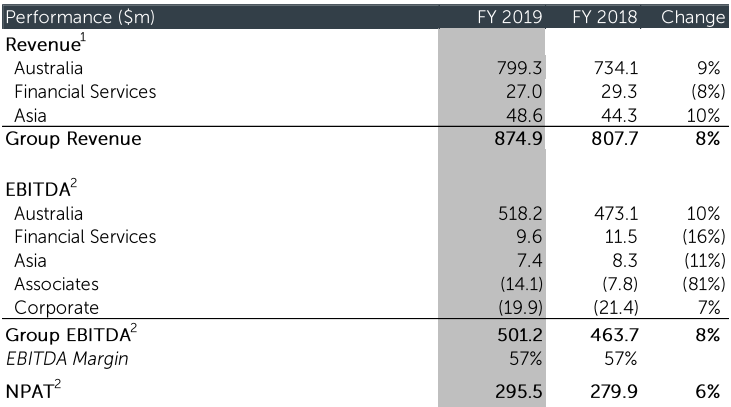
FY19 Financial Highlights (Source: Company Reports)
Stock Update: On 26 September 2019 (AEST 01:57 PM), the stock of REA was trading at $107.250 with a market capitalisation of $14.16 billion. The stock has generated robust return of 11.73% and 44.00% in the last three-months and six-months, respectively. The dividend yield of the stock stood at 1.1% on an annual basis while the stock is available at a price to earnings multiple of 134.86X.
Resmed INC
Resmed INC (ASX: RMD) is a software company and derives its revenue from countries like U.S., Canada, and Latin America etc.
Key financials for the year ended 30 June 2019: The company announced its full year results for financial year FY19 wherein the company reported revenue growth of 11% y-o-y at US$2.6 billion; up 13% on a constant currency basis. The company reported net profit at US$404.6 million, up 28% y-o-y. Gross margin expanded 80 bps to 59.0% during FY19. The company reported higher gross margin, as a result of positive contribution from MatrixCare, along with benefits from manufacturing and procurement efficiencies, which partially offset the decline in average selling prices.
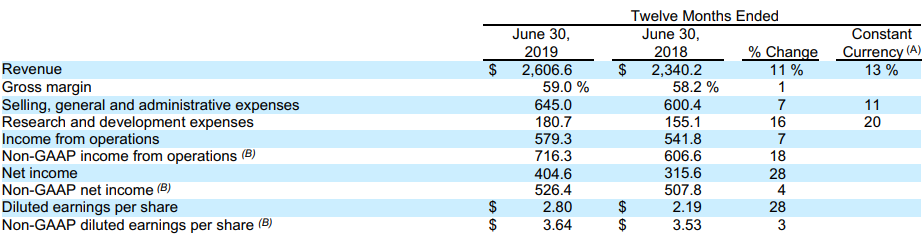
FY19 Financial Highlights (Source: Company Reports)
Stock Update: The stock of RMD was trading at $20.03 with a market capitalisation of $28.71 billion on 26 September 2019 (AEST 01:58 PM). The stock has generated stellar return of 15.65% and 42.06% in the last three-months and six-months, respectively. The dividend yield of the stock stood at 0.75% on annual basis while the stock is available at a price to earnings multiple of 49. 69x.
Disclaimer
This website is a service of Kalkine Media Pty. Ltd. A.C.N. 629 651 672. The website has been prepared for informational purposes only and is not intended to be used as a complete source of information on any particular company. Kalkine Media does not in any way endorse or recommend individuals, products or services that may be discussed on this site. Our publications are NOT a solicitation or recommendation to buy, sell or hold. We are neither licensed nor qualified to provide investment advice.
