
_07_03_2026_03_50_21_133108.jpg)


Summary
- Heico Corporation, an aerospace and defense supplier, has a P/E ratio of 58.84x and a dividend yield of 0.12% based on Friday’s closing price.
- MangoDB Inc., a document-oriented database provider, saw YTD gains of 96.98% as at the close of trade on Friday.
- Nutanix Inc., a cloud services provider, saw YTD gains of 32% as at the close of trade on Friday.
On Friday, September 1, 2023, the S&P 500 IT index rose by a little over 7 basis points. Some tech sector corporations reported their financial results during the week ending on September 1, 2023. Among these, a handful reported a rise in their year-on-year financial metrics and saw stock price gains as well.
Here is a closer look at three such stocks that reported their financial results during the week ending on September 4, 2023.
Heico Corporation (NYSE:HEI)
Heico, an aerospace and defense supplier, is the largest independent player in the aircraft replacement parts industry. Heico has a market cap over US$9.2 billion.
For Q3 of FY 2023, Heico reported net sales of US$722.9 million, an increase of 27% over the previous corresponding period. Meanwhile, Heico’s operating income increased 16% to US$149.4 million in Q1 FY2023.
Heico paid a semi-annual cash dividend of US$0.10 per share to its common stockholders on July 17, 2023.
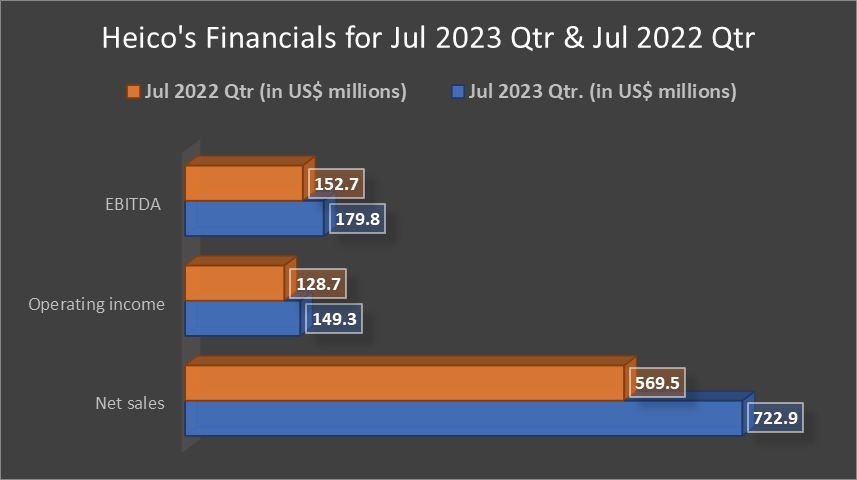
Image source: ©2023 Krish Capital Pty Ltd.; Data source: Company Reports
Based on Friday’s closing price of US$169.36, HEI has a P/E ratio of 58.84 x and a dividend yield of 0.12%. The stock grew 10.21% YTD and 0.39% intraday as at the close of trade on September 1, 2023.
MangoDB Inc. (NASDAQ:MDB)
MangoDB offers a document-oriented database that users can access through two modes: licenses and subscriptions. The software company has a market cap of over US$27.7 billion.
MangoDB reported a year-over-year jump of 40% in its total revenue for Q2 FY2024 to US$423.8 million. Gross profit for the quarter was US$318.5 million, which represented a gross margin of 75% in Q2 FY24, as compared to 71% in Q2 FY23.
For the next quarter, MDB expects to bring in revenue ranging from US$400 million to US$404 million.

Image source: ©2023 Krish Capital Pty Ltd.; Data source: Company Reports
As at the close of trade on September 1, 2023, MDB saw YTD gains of 96.98% and yearly gains of 60.9%. On an intraday basis the stock rose 3.04% as at the close of trade on September 1, 2023.
Nutanix Inc. (NASDAQ:NTNX)
Nutanix is a cloud services provider for uses such as web-scale engineering and consumer-grade design. With a market cap of over US$ 8.2 billion, Nutanix provides services across the globe and the United States forms its biggest market.
Nutanix reported Q4 FY23 revenue of US$494.2 million, as compared to US$385.5 million in Q4 FY22. This marks a year-on-year increase of 28%. Nutanix’s GAAP operating loss of US$11.3 in Q4 FY23 was lower than Q4 FY22’s GAAP operating loss of US$133.8 million.

Image source: ©2023 Krish Capital Pty Ltd.; Data source: Company Reports
As at the close of trade on Friday, September 1, 2023, NTNX stock price grew 32% on a YTD basis and 56.43% on a yearly basis. The intraday growth of the stock price on Friday was 12.22%.
