


UK Oil & Gas Plc
UK Oil & Gas Plc (UKOG) is an oil and gas exploration company. The companyâs focus is to ensure and meet the growing need of energy for the UK and to ensure the conservation of natural beauty of the region. The company is having a portfolio of investments in onshore exploration, development, appraisal and production assets.
Recent News
PEDL331Â & PEDL143 licenses operated by the company were granted an extension of two years by the Oil & Gas Authority, this shall benefit the company in completing the exploration and drilling campaign by the end of the expiration of licenses tenure.
On 7th August 2019, Wednesday, the UK Oil & Gas Plc announced the signing of an agreement with Tellurian (Tellurian Investments LLC). The agreement states that UKOG will acquire the share capital of Magellan Petroleum, a subsidiary of Tellurian for £12 million in a combination of shares and cash. Magellan holds interest of 35 per cent in Horse Hill oil field and nearby highly prospective licences (PEDL137 and PEDL246). Horse Hill oil field is the flagship asset for UKOG, and the company now holds around 86 per cent stake in Horse Hill.
Financial Highlights â H1 Financial year 2019 (£, thousand)
In the first half of the Financial year 2019, the UK Oil & Gas Plcâs reported revenue was £103 thousand as against £116 thousand for the same period of the previous year. The gross profit for the first half of the Financial Year 2019 stood at £60 thousand as compared to £62 thousand in H1 FY2018. With the decline in depletion and impairment expenses, the companyâs operating loss reduced significantly to £1,555 thousand in H1 FY2019 from a loss of £3,869 thousand in H1 FY2018. The companyâs Loss before tax and Loss after tax (continuing operations) for H1 FY2019 stood at £1,717 thousand versus a loss of £4,379 thousand in H1 FY2018. The basic and diluted loss per share stood at 0.04 pence in H1 FY2019 as compared to a loss per share of 0.12 pence in H1 FY2018.
The companyâs revenue for the first half of the financial year 2019 had declined. Though, the profitability margins have remained stagnant or declined but had significantly improved as compared to the prior-year period. The company operates in a challenging environment which requires continuous investments, sometimes at the cost of profitability, to stay ahead of the competition.
UKOG Share price performance
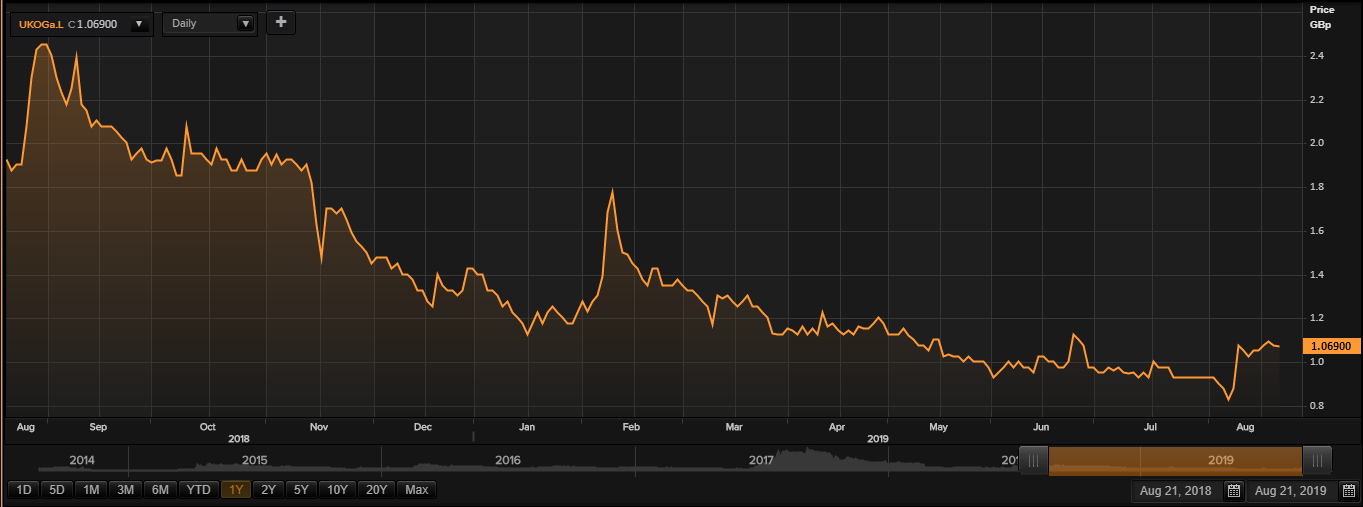
Daily Chart as on 21-August-19, before the market close (Source: Thomson Reuters)
While writing (as on 21 August 2019, at 10:50 AM GMT), UKOG shares were trading at GBX 1.06 per share; which was down by 1.85 per cent as compared to the previous day closing price level. At the time of writing, the companyâs M-cap (market capitalisation) was recorded at around £65.16 million.
In the last year, UKOG shares have touched a new peak of GBX 2.75 (as on 10 September 2018) and a bottom price level of GBX 0.80 (as on 07 August 2019). At the current trading level, as quoted in the price chart, its shares were trading at 61.45 per cent lower than the 52-week high price mark and 32.5 per cent higher than the 52-week low price mark.
While writing, the stockâs traded volume before the market close, was hovering around 15,787,411. Stock's average traded volume for 5 days was 44,699,729.60; 30 days- 48,308,794.47and 90 days â 41,967,432.74. The beta as on date of the companyâ s stock at 0.29 was inversely correlated in comparison with the index considered as the benchmark.
At the time of writing, the shares of the company were faring above the 30-days and 60-days simple moving averages, which depicts an uptrend from the current trading levels.
In the past 3 months, UKOG shares have delivered a positive return of 4.37 per cent. From the beginning of the year to till date, the companyâs stock plunged by 24.56 per cent. In the past year, the companyâs stock has delivered a negative return of 44.16 per cent.Â
The stockâs RSI (Relative Strength Index) was recorded at 54.13, 62.08 and 65.66 for the 30-days, 14-days and 9-days respectively, while the stockâs RSI was recorded at 63.80 (3-day).
Royal Mail Group Plc
Royal Mail Group Plc (RMG) is an Industrial Transportation company having operations globally. The company presently operates in around 44 countries worldwide. The company is having an employee base of 160,000 people and is delivering over 1.8 billion parcels and 14 billion letters annually. The companyâs operations are divided into 2 businesses being General Logistics Systems (GLS) and UK Operations. In the United Kingdom, the company operates under Parcelforce Worldwide and Royal Mail Brands. The company is targeting expansion outside Europe through acquisitions.
Recent developments
Royal Mail Plc announced the appointment of Sarah Hogg as Non-Executive Director effective from 1 October 2019. Sarah holds vast experience in public and private sector companies.
Financial Highlights for Financial Year 2019 (£, million)
In the financial year ending 31st March 2019 (53 weeks), the companyâs reported revenue was up by 4.02 per cent to £10,581 million against £10,172 million in FY2018. The increase in revenue was driven by the impact of the 53rd week in UKPIL segment and high revenue from parcels in the UKPIL and GLS segments.
The operating profit before transformation costs stood at £474 million in FY2019 against £236 million in FY2018. The operating profit after transformation costs stood at £341 million in FY2019 against £123 million in FY2018. The reported operating profit for the FY2019 was £160 million against £66 million in FY2018. The companyâs earnings before interest and taxation were £175 million for FY2019 versus £137 million in FY2018.
The companyâs reported profit before taxation was £241 million for FY2019 versus £212 million in FY2018. The company paid a tax expense of £66 million in FY2019 against a tax rebate of £46 million in the FY2018. The profit for the year declined by 32.17 per cent to £175 million in FY2019 from £258 million in FY2018. The companyâs reported basic earnings per share for FY2019 stood at 17.5 pence versus 25.9 pence in FY2018. The companyâs diluted earnings per share for FY2019 stood at 17.5 pence versus 25.7 pence in FY2018.
The company had delivered a decent financial performance in the current financial year. The company had shown good top-line performance. The companyâs revenue from its UKPIL and GLS businesses had shown good growth and offset the decline from its letter business. The company, through the integration of its existing acquisitions, is focusing more on B2B and selective progress in B2C. The group is improving its UK network, which will help them in the growth of e-commerce business. To make itâs business geographically diversified, the company is combining the strengths of its Royal Mail and GLS businesses.
RMG Share price performance
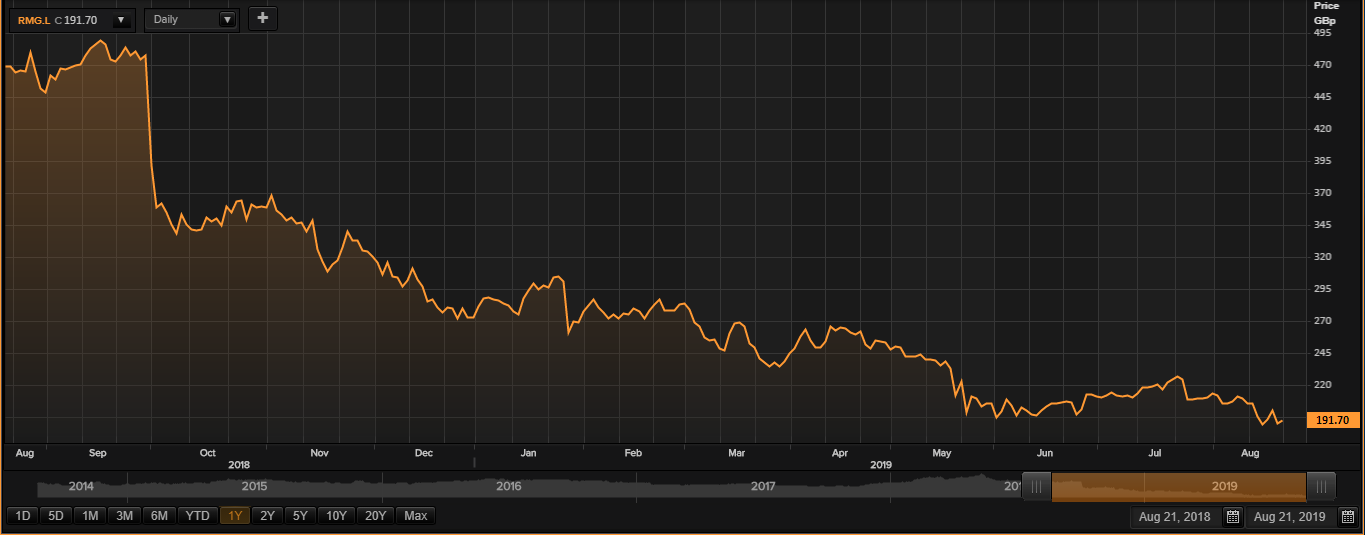
Daily Chart as on 21-August-19, before the market close (Source: Thomson Reuters)
While writing (as on 21 August 2019, at 11:00 AM GMT), RMG shares were trading at GBX 191.70 per share; which was higher by 1.08 per cent as compared to the previous day closing price level. At the time of writing, the companyâs M-cap (market capitalisation) was recorded at around £1.89 billion.
In the last year, RMG shares have registered a high of GBX 492.50 (as on 17 September 2018) and a low of GBX 186.80 (as on 15 August 2019). At the current trading level, as quoted in the price chart, its shares were trading at 61.07 per cent below than the 52-week high price level and 2.62 per cent above the 52-week low price level.
While writing, the stockâs traded volume before the market close, was hovering around 834,714. Stock's average traded volume for 5 days was 7,977,267.80; 30 days- 5,134,832.27and 90 days â 7,107,354.87. The beta of the company as on date was 0.76 which means it is 24 per cent less volatile in comparison with the index considered as the benchmark.
At the time of writing, the shares of the company were faring below the 30-days and 60-days simple moving averages, which depicts a downtrend from the current trading levels.
In the past 1 year, RMG shares have delivered a negative return of 59.54 per cent. Also, on a YTD (Year-to-Date) time interval, the stock plunged by approximately 30.30 per cent and was down by 18.57 per cent in the last three months.
Share's RSI (Relative Strength Index) was recorded at 40.08, 35.97and 33.81 for the 30-days, 14-days and 9-days respectively, while the stockâs RSI was recorded at 32.02(3-days).
The company has been consistent in paying dividends to investors. In the last six years, the companyâs highest dividend yield has been of 10.49 per cent (FY19), while its lowest has been of 2.36 per cent (FY14). The mean annual dividend yield was around 5.37 per cent in the past six years.
