


_07_03_2026_03_50_21_133108.jpg)

Galliford Try PLC
Galliford Try Plc (Identifier: GFRD) is a UK based Household Goods company engaged in the business of housebuilding, regeneration and construction. Its areas of operation are categorised into segments like Linden Homes, Galliford Try and Morrison Construction. Its shares are traded on the London Stock Exchange, and it's a constituent of FTSE 250 index. The company came into existence in the year 2000. The shares of the company got admitted to the London Stock Exchange (LSE) on 27th March 1972 with the ticker symbol âGFRDâ.
GFRD-Recent News
As per some media reports, the companyâs CEO, Graham Prothero will be moving to Bovis Homes Group Plc on a senior role. Bovis Homes is reportedly buying Linden Homes by Galliford.
GFRD-Financial Highlights for FY19
For the financial year ending 30th June 2019, the companyâs revenue (including joint venture share) declined to £2,863 million as against £3,132 million in FY2018. The groupâs revenue for FY2019 stood at £2,711 million versus £2,932 million in FY2018. The decline in the revenue was driven by a decline in revenue from Linden Homes and Construction & Investments businesses for the period. In FY2019, adjusted gross profit declined to £287.7 million as against £330.2 million in FY2018. The reported gross profit declined to £242.9 million in FY2019 as against £285.2 million in FY2018. The companyâs Pre-exceptional PBT (Profit before tax) declined to £155.5 million in FY2019 versus £188.7 million in FY2018. The companyâs reported PBT (Profit before tax) declined to £104.7 million in FY2019 versus £143.7 million in FY2018. The companyâs profit for the year stood at £86.9 million in FY2019 as against £118.3 million in FY2018. The companyâs basic pre-exceptional earnings per share stood at 115.7 pence in FY2019 versus 158.4 pence in FY2018. The companyâs basic reported earnings per share stood at 78.5 pence in FY2019 versus 121.1 pence in FY2018. The companyâs diluted pre-exceptional earnings per share stood at 115.6 pence in FY2019 versus 157.8 pence in FY2018. The companyâs diluted reported earnings per share stood at 78.4 pence in FY2019 versus 120.6 pence in FY2018. The companyâs full-year dividend declined to 58 pence for FY2019 versus 77 pence in FY2018.
The company had shown resilient trading in the core businesses for the financial year 2019 with strong foundations, supported by a strong balance sheet and increased focus on high-quality earnings which will drive future margins. The companyâs revenue and profits become more resilient with the introduction of Partnership and Regeneration Business. The business has witnessed strong demand from local authority partners and Registered Provider. Their residential development builds a robust premise in more uncertain markets. The company is significantly exposed to the Brexit deal, and any hard Brexit will have a significant impact on its Linden Homes segment.
GFRD-Share price performance

1-year share price performance (source: Thomson Reuters)
At the time of writing (21/10/19 before the market close, at 02:42 PM GMT), shares of the GFRD were trading at GBX 771.6 and plunged by 0.18 per cent against the previous closing price.
Volume Summary
The 5-day average daily shares exchanged hands were stood at 783,525.80, which was around 7.07 per cent below the 30-day average daily volume (843,169.60) exchanged hands at the London Stock Exchange. Todayâs volume in the stock stood at 251,194 with 756 trades took place at the London Stock Exchange (before the market close).
52wk H/L range
In the past 52-wks, shares of the GFRD have registered a high price of GBX 918.00 and a low price of GBX 499.60, and at the current trading level, as quoted in the price chart, shares were quoting around 54.44 per cent above the 52w low price level.
Price Performance (%)
On a YoY basis, shares of the GFRD have delivered a negative price return of 13.34 per cent and the benchmark index by approximately 14.84 per cent down over the same period. However, on a year-to-date basis, the stock has recorded a positive price return of approximately 24.08 per cent and was up by around 14.94 per cent in the past one month.
Simple Moving Average (SMA)
From the Simple Moving Average standpoint, shares were quoting above the 200-day simple moving average price and quoting above its 60-day and 30-day SMA prices as well.
Relative Strength Index (RSI)
The 30-day and 14-day relative strength index were strengthening at 65.95 and 74.73 respectively.
National Express Group Plc
United Kingdom-headquartered, National Express Group Plc (Identifier: NEX) is a Travel and Leisure company, and its operating segments include UK Bus, UK Coach, German Rail, North America, Spain and Morocco. As on 26th April 1995, shares of the National Express Group Plc were got admitted to the main market of the LSE for trading. Newton Investment Management Ltd., M&G Investment Management Ltd. and Standard Life Investments Ltd are the main institutional investors. (Source: TR) NEX-Recent Developments
The group announced as on Oct-16-19, that its Spanish and Moroccan division, ALSA, has been granted a major bus contract in Casablanca, for up to 15 years. The company will be able to muster more than â¬1 billion of revenues.
NEX-Trading Update
The group reported its trading update (on Oct-17-19) for the period from July 01 to Sep 30, 2019. During the period, group's performance was decent with its revenue surged 14.5% in reported terms and by 11.8% on a constant currency basis, driven by the solid performance of the group's Spanish and Moroccan division, ALSA. Group's operating profit during the period under consideration surged by 14.3% in reported terms and 15.0% on a constant currency basis.
Group's segment-specific performance was also decent, with North America revenue recorded a growth of 20.6% at constant currency terms, with recently acquired WeDriveU performing broadly in line with the group's expectation. ALSA's revenue surged by 8.5% at constant currency basis, largely driven by organic growth and passenger numbers for the segment also surged by 9.5%, however the group's performance in the UK was mix with UK coach core revenue increased by 3.1%, whereas commercial bus revenue grew just 0.7%, driven by weak passenger growth.
In the latest trading update reported by the company for the July 01 to September 30, the groupâs performed well, with decent revenue growth, operating profit growth and margins. Also, the recent major bus contract which the group secured in Casablanca, for up to 15 years, will boost the group's top line in the coming months. Also, despite a decent surge in the stock price over the year-ago period, the dividend yield of the company stood at 3.39%, which is a crucial measure for an income investor as well.
NEX-Share price performance
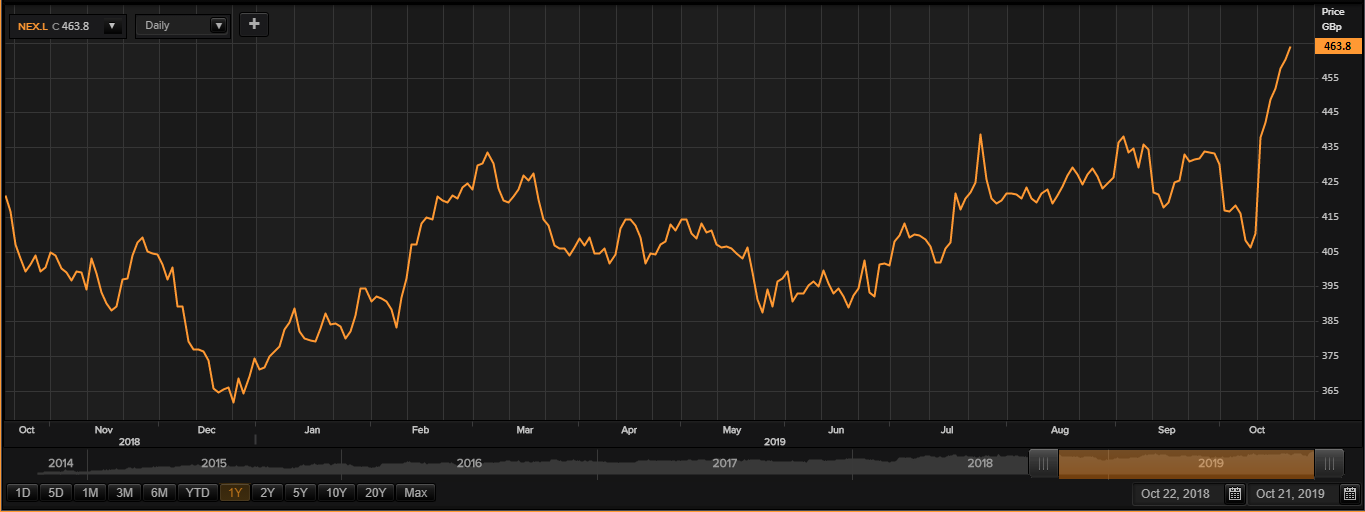
1-year share price performance (source: Thomson Reuters)
At the time of writing (21/10/19 before the market close, at 02:47 PM GMT), shares of the NEX were trading at GBX 463.8 and surged by 0.82 per cent against the previous closing price.
Volume Summary
The 5-day average daily shares exchanged hands were stood at 890,538.20, which was around 98.98 per cent above the 30-day average daily volume (447,549.17) exchanged hands at the London Stock Exchange. Todayâs volume in the stock stood at 457,012 with 886 trades took place at the London Stock Exchange (before the market close).
52wk H/L range
In the past 52-wks, shares of the NEX have registered a high price of GBX 464.00 and a low price of GBX 356.00, and at the current trading level, as quoted in the price chart, shares were quoting around 30.28 per cent above the 52w low price level.
Price Performance (%)
On a YoY basis, shares of the NEX have delivered a positive price return of 9.58 per cent and the benchmark index by approximately 7.68 per cent up over the same period. However, on a year-to-date basis, the stock has recorded a positive price return of approximately 22.99 per cent and was up by around 8.29 per cent in the past one month.
Simple Moving Average (SMA)
From the Simple Moving Average standpoint, shares were quoting above the 200-day simple moving average price and quoting above its 60-day and 30-day SMA prices as well.
Relative Strength Index (RSI)
The 30-day and 14-day relative strength index were strengthening at 63.91 and 71.90 respectively.
