


Associated British Foods Plc
Associated British Foods Plc (ABF) is a London-based diversified group of companies offering a wide range of products and services which are marketed through many widely known brands and enjoy a high degree of autonomy, with operations in 52 countries across Europe, southern Africa, the Americas, Asia and Australia. The group has five reporting segments being Agriculture, Sugar, Ingredients, Retail and Grocery.
ABF-Financial highlights for FY19
For 52 weeks ended 14 September 2019, revenues were 2% higher than last year at £15.8 billion and adjusted operating profit was 1% higher at £1,421 million, driven by strong performances from Grocery and Primark, as sales at Primark were 4.2% ahead of last year at actual exchange rates and 4.1% ahead at constant currency, while Grocery revenues were 2% ahead of last year at constant currency. Adjusted profit before tax rose by 2% to $1,406 million, while statutory profit before tax was down 8% to £1,173 million. Adjusted earnings per share increased by 2% from 134.9p to 137.5p, and earnings per ordinary share were 13% lower than last year at 111.1p due to the loss on the closure of businesses and exceptional items, while earnings attributable to equity shareholders in the current year were £878 million. Net cash inflow from operating activities rose to £1,509 million, and net assets increased by £0.3 billion to £9.6 billion.
Driven by strong performances from Grocery and Primark, the company reported an increase in the profits of our non-sugar activities, which showed the resilience of the group in a year when its ongoing sugar businesses experienced a significant drop in profits.
Â
ABF-Share price performance
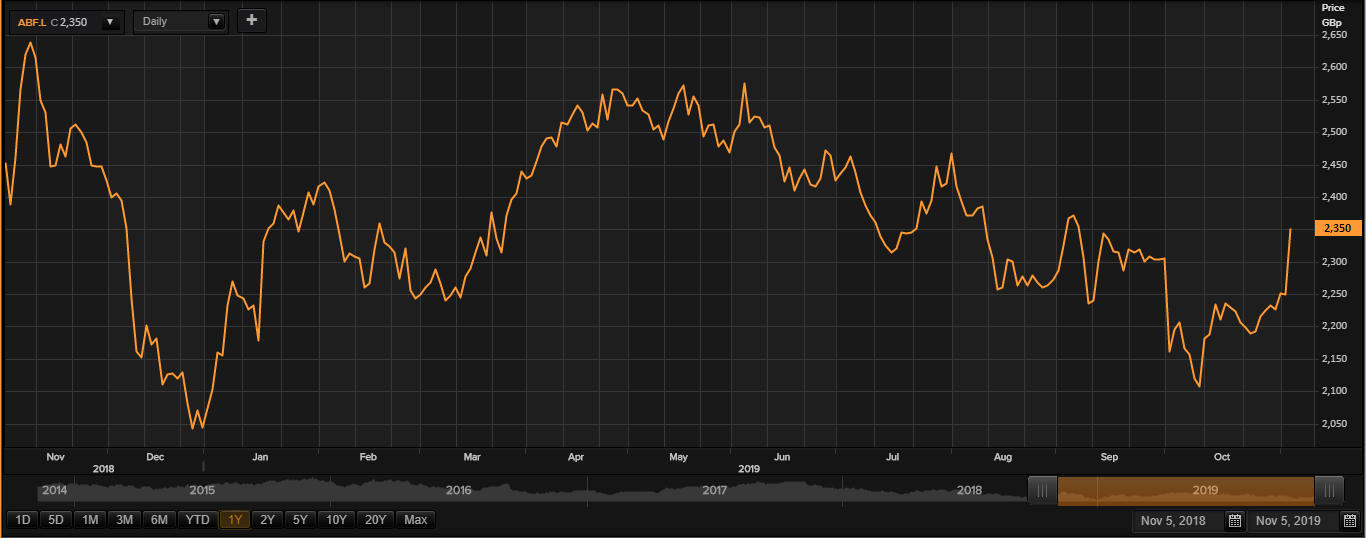
(Source: Thomson Reuters)
While writing (as on 05th November 2019, at 12:36 PM GMT), Associated British Foods Plc shares were trading at GBX 2,350 per share; surged by 4.49 per cent as compared to the previous day closing price level. The companyâs market capitalisation was around £17.88 billion.
ABF shares have clocked a high of GBX 2,659.00 (as on 12th November 2018) and a low of GBX 2,011.00 (as on 02 January 2019) in the past year. At the current price point, as quoted in the price chart, the companyâs shares were trading 11.62 per cent below the 52-week high price point and 16.85 per cent above the 52-week low price point.
At the time of writing, the stockâs volume before the market close, stood at 668,499. Stock's average daily traded volume for 5 days was 723,397.60; 30 days- 952,610.07 and 90 days â 853,263.77. The companyâs stock beta (5Y monthly) was 0.95, which makes it slightly less volatile as against the benchmark index.
The average daily traded volume for 5 days plunged by 24.06 per cent as against 30 days average daily traded volume. At the time of writing, the shares of the company were trading below the 60-days and 200-days SMA.
In the past 1 month, ABF shares have delivered a positive return of 2.00 per cent. Also, on a YTD (Year-to-Date) time interval, the stock surged by approximately 10.08 per cent and was down by 6.91 per cent in the last three months.
Share's RSI (Relative Strength Index) for the 30-days, 14-days and 9-days was recorded at 48.67, 54.70 and 61.29 respectively. Also, the stockâs 3-days RSI was recorded at 81.95.
Â
Smurfit Kappa Group Plc
London Stock Exchange-traded Smurfit Kappa Group Plc (SKG) is a provider of paper packaging solutions. The group mainly focus on manufacturing, distributing and marketing of corrugated containerboards, containers and other paper-based packaging goods. As on March 20, 2007, its shares were admitted to the main market of the London Stock Exchange and its stock is a constituent of the UKâs broader FTSE 100 index.
SKG-Trading Update -(9 months period in FY19 ended as on September 30, 2019)
During the nine-months under consideration, the group's revenue recorded a growth of 3% to â¬6,850m, EBITDA surged 11% to â¬1,257m, and EBITDA margin expanded 140bps against the comparable period to 18.3% respectively. In Europe, its corrugated box witnessed a volume spurt of 4% on a YoY basis or approximately 2% organically. Also, the corrugated box was broadly in line with the management's expectations. In the Americas, volume grew by 2% organically with EBITDA, and EBITDA margin continued to record an improvement on YoY basis. In September 2019, the group issued â¬750m bond at a coupon rate of 1.5% with 8-year maturity, which was a lower average interest rate for the group.
SKG-Financial highlights for H1 FY19
During the first-half under consideration, the group's revenue surged by 4% to â¬4,622m, and EBITDA spurt by 17% to â¬847m from â¬724m a year-ago, driven by European business EBITDA which grew by 19.3% from 17.3% reported in the comparable previous period, and the Americas business EBITDA surged by 17.1% against 15.2% recorded a year before period, respectively.
The group's EBITDA margin improved to 18.3% in H1 FY19 from 16.4% in H1FY18 which reflects the resilience of the Groupâs integrated model, the benefits of capital spend programme, volume growth, higher corrugated pricing, lower recovered fibre costs and the impact of IFRS 16, Leases.
Basic Earnings Per Share expanded by 8% to 140.6 cents in H1 FY19 from 124.5 cents reported in the same period of the previous financial year. Free cash flow rushed by 8% to â¬159m. The return on capital employed improved by 60bps to 18.7% and Net Debt surged substantially to â¬3,751m from â¬2,871m reported at the end of H1FY18.
SKG-Share price performance

(Source: Thomson Reuters)
While writing (as on 05th November 2019, at 12:45 PM GMT), Smurfit Kappa Group PLC shares were trading at GBX 2,754 per share; lower by 0.14 per cent as compared to the previous day closing price level. The companyâs market capitalisation was around £6.62 billion.
SKG shares have clocked a high of GBX 2,772.00 (as on 04th November 2019) and a low of GBX 1,915.00 (as on 11 December 2018) in the past year. At the current price point, as quoted in the price chart, the companyâs shares were trading 0.64 per cent below the 52-week high price point and 43.81 per cent above the 52-week low price point.
At the time of writing, the stockâs volume before the market close, stood at 167,199. Stock's average daily traded volume for 5 days was 315,315.60; 30 days- 308,459.17 and 90 days â 323,837.83. The companyâs stock beta (5Y monthly) was 1.15, which makes it more volatile as against the benchmark index.
The average daily traded volume for 5 days surged by 2.22 per cent as against 30 days average daily traded volume. At the time of writing, the shares of the company were trading above the 60-days and 200-days SMA.
In the past 1 month, SKG shares have delivered a positive return of 14.73 per cent. Also, on a YTD (Year-to-Date) time interval, the stock surged by approximately 32.47 per cent and was up by 7.40 per cent in the last three months.
Share's RSI (Relative Strength Index) for the 30-days, 14-days and 9-days was recorded at 60.51, 68.75 and 74.65 respectively. Also, the stockâs 3-days RSI was recorded at 89.07.
Â
