


Serco Group Plc (LSE:SRP), is the United Kingdom-headquartered business support services company. Their area of operations is divided into segments like Defence, Justice & Immigration, Transport, Health and Citizen Services. Its shares are listed on the main market of the London Stock Exchange and got admitted in 1988, on the bourse for trading. The group is a constituent of FTSE All-Share, FTSE 350 and FTSE 250 indices. Its geographical area of operations is divided into four; the UK, Americas, Asia Pacific and the Middle East.
Institutional Ownership
BlackRock Investment Management (UK) Ltd, Fidelity International, Marathon Asset Management LLP, Majedie Asset Management Limited, MSD Partners LP, Orbis Investment Management Ltd, RWC Partners Ltd, UBS Asset Management (UK) Ltd., Jupiter Asset Management Ltd., and The Vanguard Group Inc are the top ten institutional Investors in the company. As per the latest data available, 67.54% stake in the group is owned by the institutional investors.
As on June 27, 2019, the group reported its closed period trading update for the first half of the FY19. In the exchange filing, the business support services group reported a 6% increase in the revenue and a 4% organic growth, primarily driven by revenue increase in the Americas and Asia Pacific division. For the period under consideration, the underlying trading profit increased by 20 per cent on a YoY basis. Order intake during the first half was more than £3 bn, and FY19 would be the third consecutive year in which order intake would exceed revenue.
The group also mentioned that full-year revenue for the financial year 2019 would be at the top end of earlier forecasted £2.9-3 bn range. However, underlying trading profit guidance for the full year 2019 was maintained at £105 mn.
During the first half of FY19, the group announced the acquisition of NSBU, which will be funded by equity placing and new bank financing. The deal is expected to materialize in the second half of 2019. As on June 30, 2019, adjusted net debt would be in the range of £210 mn to £230 mn. However, post-acquisition of NSBU in the second half, full-year adjusted net debt is expected to be around £250 mn, and underlying leverage is to be around 1.5x.
The group also mentioned that in the H1 FY19, revenue would approach £1.5bn, and underlying trading profit would be approximately £50 mn. This included favourable currency movement in aggregate and expected to benefit the group's top-line by £20 mn and Underlying Trading Profit in the range of £1m to £2m.
In the first half of FY18, the group posted a revenue of £1,366 mn, and Underlying Trading Profit in the same period was at £37.6mn. The group is estimating a potential growth of 6 per cent in the top line on a YoY basis and 20% surge in the Underlying Trading Profit (excluding IFRS16 effects). In the H1 FY19 revenue, the group is estimating a 2 per cent contribution from the recently acquired business. The recorded surge in the groupâs Underlying Trading Profit was primarily driven by the Americas division and mainly because CMS contract that has been re-awarded to the Serco Plc in June 2018.
Serco's order intake has been firm enough, mainly on account of the signing of an agreement for asylum accommodation and support services in Britain and valued at £1.9 bn and defence healthcare order intake in Australia, valued at £0.6 bn.
Financial Performance â FY18
As on February 21, 2019, the Serco Group Plc reported its full year financial results for the year ended December 31, 2018. During the year under consideration, revenue from operation narrowed to £2,836.8 mn from £2,950.9 mn recorded in the year-ago period. Revenue was narrowed by 4 per cent on reported currency basis and by 2 per cent on constant currency basis. Reported operating profit from operation bumped by 282 per cent to £80.5 mn from £21.1mn reported during the corresponding period of the previous financial year and on a constant currency basis, reported operating profit jumped by 300 per cent. Underlying trading profit for the financial year 2018 stood at £93.1 mn from £69.3 mn posted in the year-ago period. Underlying earnings per share jumped by 55 per cent to 5.21 pence per share against the EPS of 3.36 pence per share in FY17 and on a reported basis (including exceptional items), earnings per share surged to 5.99 pence per share against per share loss of 0.76 pence recorded in the year-ago time.
Free cash flow for the financial year ended December 31, 2018, stood at £25.0 mn from an outflow of £6.7 mn in FY17 and at the end of the FY18, groupâs net debt position stood at £188.0 mn from £141.1 mn reported at the end of FY17. Net debt during the FY18 increased by £47mn, mainly because of positive free cash flow was partially offset by exceptional items of £19mn, net acquisition during the FY18 for consideration of £31 mn and £22 mn a net forex impact, on account of groupâs US$ denominated debt.
During the FY18, the group exercised several strategic acquisitions, like acquired BTP system for a total amount of £13mn in February 2018, this was mainly exercised to enhance their satellite and radar capabilities and now fully synchronised with their US defence business.
On a YoY basis, order book nudged to £12.0 bn in FY18 from £10.7 bn reported in the year-ago period, primarily an order worth £0.7 bn included post acquisition of Carillion health facilities management contracts. Order intake during the FY18 stood at £2.9 bn and out of this, around 80 per cent order intake was from Americas, Middle East, Asia Pacific and continental of Europe and around 20 per cent from the United Kingdom.
However, the overall performance of the group during FY18 was decent as after three consecutive years of outflows, the group's free cash flow turned positive and stood at £25 mn.
Stock Information
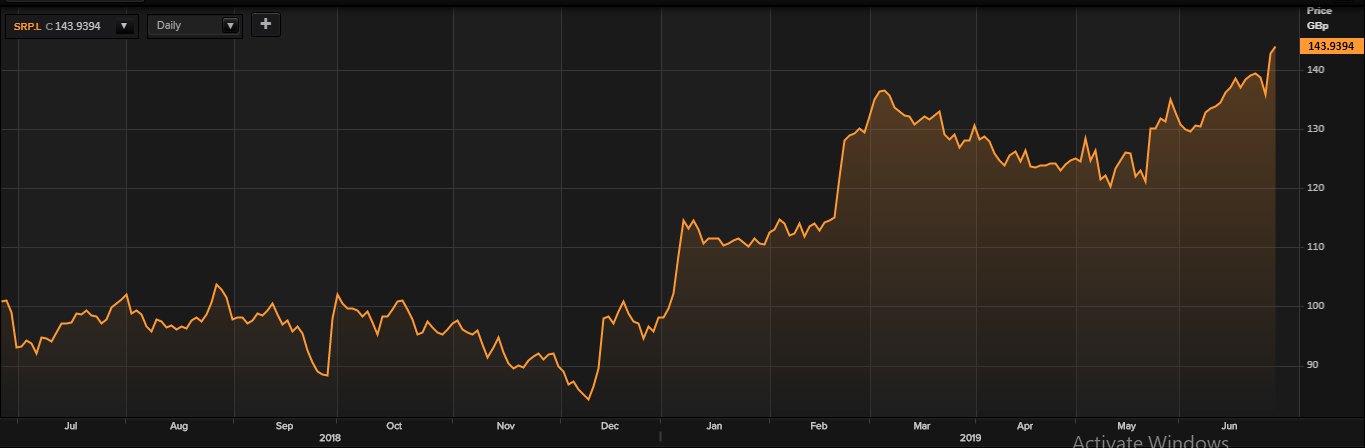
Daily Price Chart (as on June 28, 2019), before the market close. (Source: Thomson Reuters).
At the time of writing (before the market close, at 09:44 AM GMT), the share of the SRP was quoting at GBX 143.93 and added 1.2 points or 0.84 per cent against the previous day closing price level. The outstanding market capitalisation of the company stood at £1.74 bn. At the current trading level, the dividend yield of the company stood at 0.83 per cent, which is considerably below the dividend yield of the FTSE 100 index.
52-wks High/Low range
In the year-ago period, shares of the Serco Plc have registered a 52w high of GBX 146.50, and a low of GBX 83.50 and at the current trading level, shares were quoting around 71.0 per cent above the 52w low price level and approximately 2.53 per cent below the 52w High price level. The percentage from the 52w H/L range indicates that the stock is in the bull rally and carrying the potential to register a new 52w high in near-term (ceteris paribus).
Volume Summary
The 5-day average daily volume traded on the London Stock Exchange was at 2,618,112.20, which was around 16 per cent above the 30-day average daily volume traded at the London Stock Exchange. Todayâs volume in the stock (before the market close), stood at 264,266 with 149 traded took place at the LSE.
Price Performance (%)
On a YoY basis, shares of the SRP have delivered a price return of 42 per cent, and on a year-to-date basis, the stock was up by approximately 50 per cent. In the last one month, the stock was up by approximately 10 per cent.
Simple Moving Average (SMA)
From the SMA standpoint, the share of the SRP was quoting considerably above the 200-days and 60-day SMA price levels, which indicates the stock is hovering in a bull-run and expected to surge further from the current trading level. At the current market price, the stock was quoting around 27 per cent above the 200-day SMA price level.
Relative Strength Index (RSI)
The 30-day and 14-day RSI level in the stock hovering in the neutral zone and strengthening the upside potential of the stock from the current trading levels.
PE Range
In the year-ago period, the stock has registered a 52w high PE of 49.3x and a 52w low PE of 19.5x and at the current trading level, the TTM PE of the stock stood at 23.6x, whereas industry average TTM PE (x) stood at 36.11, which provide headroom to Serco Plâs stocks to surge further from the current trading level. As the stock is available at a lower valuation against the peer group companies.
The bottom line is, the overall scenario in the stock looks fine and carrying decent potentials to move up further from the current trading. However, showering global economy and Irked tension between the US and Iran could impact the stock performance in the near term.
