


BP PLC
BP PLC (BP) is a London-headquartered global energy business with a diverse portfolio across businesses, resource types and geographies, and operations in 78 countries worldwide. It is one of the six supermajor oil group in the world, with operations in Africa, Asia, Australasia, North and South America and Europe. The group was established as Anglo-Persian Oil Company in 1909 with the aim of exploring and producing oil in Persia, which was renamed as the British Petroleum Company in 1954. The group, through a series of risky ventures and acquisitions has become one of the biggest names in the energy market, delivering energy products and services to people around the world. The group was listed on the London Stock Exchange in 1954 and is currently a constituent of the FTSE 100 index.
BP-Recent News
On 4th October 2019, the company issued a press release, according to which Bob Dudley (CEO) will retire on 31st March 2020 after serving the company for 40 years. He will be succeeded by Bernard Looney on 5th February 2020 post release of results of the fiscal year 2019.
BP-Financial Highlights for H1 FY19
Underlying production was broadly flat during the period, and it increased by 0.7% in the second quarter. Due to a fall in revenue from downstream segment, which declined to $124,812 million from $130,580 million in the H1 2018 and $66,396 million in Q2 2019 from $69,174 million in Q2 2018, sales and other operating revenues decreased from $143,611 million in H1 2018 to $138,997 million in the current period and $72,676 million in Q2 2019 from $75,439 million in the second quarter of 2018. This reflected in a fall in total revenues and other income as it declined from $146,050 million in the first half of 2018 to $141,154 million in the comparative latest period, while it decreased to $73,747 million in the second quarter of 2019 from $76,907 million in the corresponding period of last year. Profit before interest and taxation was reported at $9,680 million compared to $10,051 million in H1 2018, while profit before taxation was $7,930 million, down from $8,901 million in H1 2018. As replacement cost profit before interest and tax of upstream segment declined to $5,353 million from $6,688 million for the same period in 2018, the corresponding value for the group fell to $8,490 million from $8,658 million in the first half of 2018, despite an increase in the downstream segment to $3,053 million from $2,553 million in H1 2018. Replacement cost profit was $3,870 million for the half-year, compared with $4,178 million in H1 2018, while underlying replacement cost profit was $5,169 million, compared with $5,408 million in H1 2018. Replacement cost profit was $1,775 million for the second quarter, compared with $1,789 million in the second quarter of 2018, while underlying replacement cost profit for the second quarter was $2,811 million, compared with $2,822 million in Q2 2018. Compared to a profit of $2,799 million and $5,268 million in the second quarter and the first half of 2018 respectively, profit was $1,822 million and $4,756 million for the same periods in 2019, corresponding to basic earnings per share of 23.47 cents in the first half and 8.95 cents in the second quarter. Subsequently, the group declared a quarterly dividend of 10.25 cents. Excluding Gulf of Mexico oil spill payments, operating cash flow was $14.2 billion for the half-year and $8.2 billion for the second quarter, while net debt at 30 June 2019 was $46.5 billion, compared with $38.7 billion a year ago.
BP Plc-Share price performance
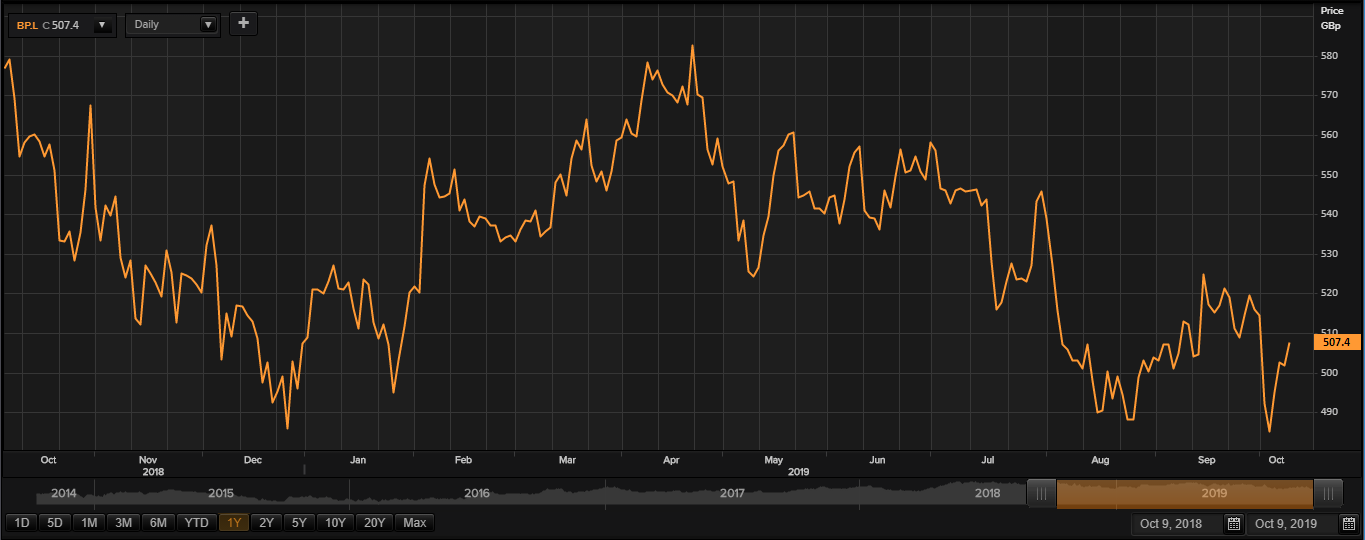
At the time of writing (at 02:00 PM GMT, as on 09 October 2019,) BP Plc shares clocked a price level of GBX 507.4 per share; which was up by 1.15 per cent in comparison to the last day trade closing price. Market Capitalisation of the company stood at £103.04 billion at the time of writing.
BP shares have touched a peak on 10 October 2018 of GBX 584.40 and a trough on 03 October 2019 of GBX 479.55 in the past year. At the current trading level, as shown in the price chart, the companyâs shares traded at 13.17 per cent less than the 52-week peak point and 5.80 per cent more than the 52-week trough point.
Before the market close, at the time of writing, the stockâs volume was around 12,822,696. Stock's mean daily traded volume for 5 days stood at 33,942,223.00; 30 days- 32,643,920.13 and 90 days â 31,415,970.66. The companyâs stock beta (5Y monthly), which is a measure of the volatility of the stock, stood at 1.40, which means that the companyâs stock is more volatile in comparison to the benchmark index.
The companyâs 5 days average traded volume was up by 3.98 per cent as against average traded volume for 30 days. At the time of writing, the shares of the company traded below than the simple moving average of 30-days and 60-days.
BP shares have delivered a positive return of 0.12 per cent in the past one month. Also, from January to till date, the stock was up by approximately 1.14 per cent and was down by 8.12 per cent in the last quarter.
30-days, 14-days and 9-days RSI (Relative Strength Index) of the stock were recorded at 46.37, 46.54 and 46.13 respectively.RSI of the stock for 3-days was recorded at 55.59.
Â
Tesco PLC
Tesco PLC (TSCO) is a United Kingdom-based retail company and is one of the largest retailers of consumer goods in the world, serving millions of customers every week through stores as well as online space. While the group also offers insurance and retail banking services, it mainly operates as a retailer of grocery products. The operations of the group are differentiated in two operating segments, namely Retail and Tesco Bank. The Retail division is further divided into three geographical segments: UK & ROI, Asia and Central Europe.
TSCO-Recent News
The group CEO of Tesco Plc, Dave Lewis has decided to step down and announced his separation from the company by the summer for 2020. Ken Murphy will be the new CEO of the company and will take charge next summer.
TSCO-Financial highlights for H1 FY20
The companyâs net interest income was recorded at £240.1 million in H1 FY20 as against £230.7 million in H1 FY19. The companyâs income from Net fees and commissions was recorded at £169.8 million in H1 FY20 as against £169.7 million in H1 FY19. The companyâs total income was recorded at £406.8 million in H1 FY20 as against £408.1 million in H1 FY19.  The companyâs operating profit stood at £9.6 million in H1 FY20 as against £54.3 million in H1 FY19.
Â
Tesco Plc-Share price performance
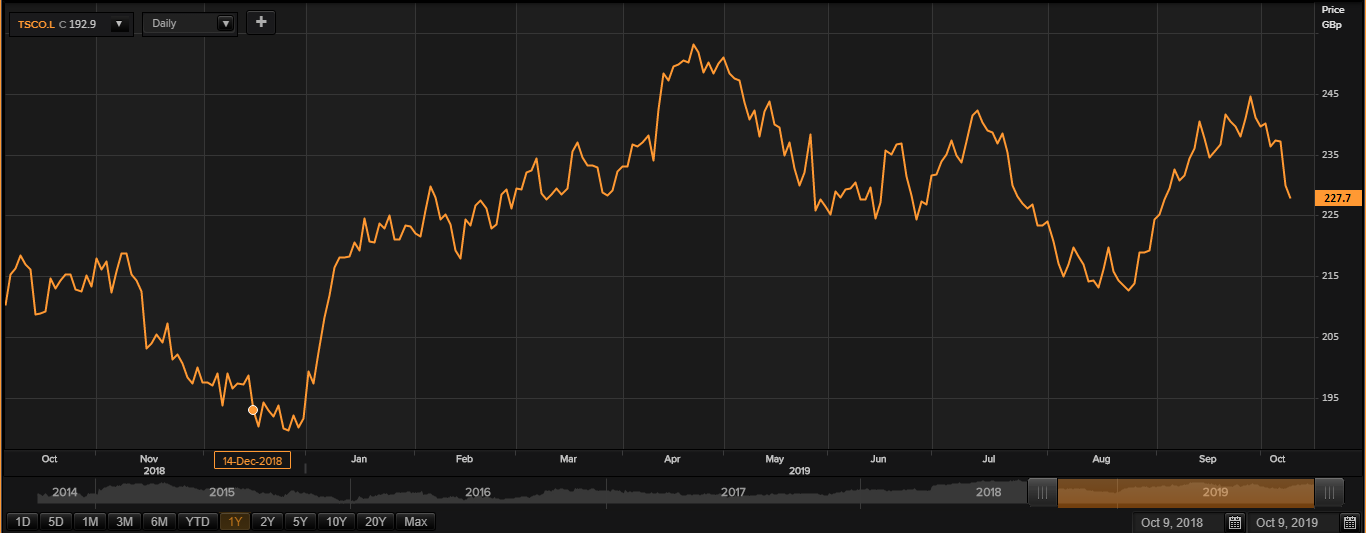
At the time of writing (at 02:06 PM GMT, as on 09 October 2019,) Tesco PLC shares clocked a price level of GBX 227.70 per share; which was down by 0.91 per cent in comparison to the last day trade closing price. Market Capitalisation of the company stood at £22.64 billion at the time of writing.
TSCO shares have touched a peak on 23 April 2019 of GBX 254.10 and a trough on 28 December 2018 of GBX 187.05 in the past year. At the current trading level, as shown in the price chart, the companyâs shares traded at 10.38 per cent lower than the 52-week peak point and 21.73 per cent more than the 52-week trough point.
Before the market close, at the time of writing, the stockâs volume was around 6,673,683. Stock's mean daily traded volume for 5 days stood at 29,252,107.60; 30 days- 20,139,984.60 and 90 days â 21,101,590.51. The companyâs stock beta (5Y monthly), which is a measure of the volatility of the stock, stood at 1.07, which means that the companyâs stock is more volatile in comparison to the benchmark index.
The companyâs 5 days average traded volume was up by 45.24 per cent as against average traded volume for 30 days. At the time of writing, the shares of the company traded above than the simple moving average of 60-days and 200-days.
TSCO shares have delivered a negative return of 1.16 per cent in the past one month. From January to till date, the stock was up by approximately 20.88 per cent and was down by 2.09 per cent in the last quarter.
30-days, 14-days and 9-days RSI (Relative Strength Index) of the stock were recorded at 48.84, 42.42 and 33.90 respectively. Also, RSI of the stock for 3-days was recorded at 8.91. Â
