


Silence Therapeutics Plc
Silence Therapeutics Plc (LON:SLN) is a London, United Kingdom based pharmaceuticals and biotechnology company, majorly involved in the research and development of pharmaceutical products based on RNA (ribonucleic acid) technology. This technology harnesses the bodyâs natural occurring mechanisms to create therapeutic effects within own cells of the body. Companyâs pipeline basically includes various programmes under three core categories which are haematology, Cardiovascular diseases and rare diseases. Under Haematology, the different programmes include Beta Thalassaemia, which has completed the pre-clinical phase, Myelodysplastic Syndrome, which also has completed the Pre-clinical phase and an undisclosed indication which is in the discovery phase.
SLN Share Price Performance
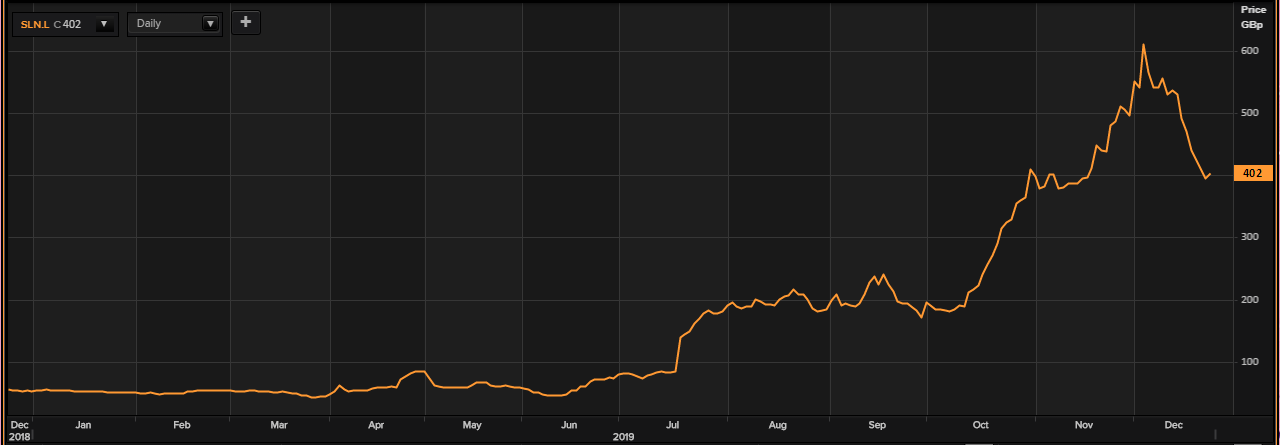
(Source: Thomson Reuters) Daily Chart as on 24-December-19, before the close of the market
As on 24th December 2019, at 12:05 P.M Greenwich Mean Time, while writing, Silence Therapeutics Plcâs price of the stock was reported at GBX 402.00 per stock on the London Stock Exchange, an increase in the value of 2.03 per cent or GBX 8.00 per stock, as opposed to the last dayâs closing price, which was reported at GBX 394.00 per stock. The companyâs market capitalisation stood at a value of GBP 308.00 million in relation to the present market price of the share of the company.
Reportedly, Silence Therapeutics Plcâs stock has given an upside return of around 663.10 per cent in value in the last one year, from the price of GBX 52.68 per stock that the stocks set on December 24, 2018. The Silence Therapeutics Plc share has depicted an upside return in the previous half-year, of approximately 470.21 per cent from the price of GBX 70.50 per stock that the companyâs stock achieved on June 24, 2019. Silence Therapeutics Plcâs stock though had lost value by 16.25 per cent, in the previous month from the price of GBX 480.00 per stock when the markets closed on November 25, 2019.
Companyâs share beta was reported to be at a value of 1.10, which means that the movement of the share of Silence Therapeutics Plc, has been more volatile, in comparison with the movement of the comparative benchmark index in the last one year.
CVS Group Plc
CVS Group Plc (LON:CVS) is a Diss, United Kingdom headquartered veterinary service providing company. The organisation professes to be the biggest coordinated veterinary specialist organisation in the UK, operating more than 450 veterinary medical procedures all through England, Northern Ireland, Scotland and Wales and provides treatment to small animals, large animals as well as equine animals. The organisation has a veterinary analytic practice with four research centres, seven pet crematoria, Animal Direct - the companyâs e-commerce portal, Pet Medic Recruitment â the companyâs veterinary recruitment agency, the healthy pet club - company promoted largest preventive pet Healthcare scheme in the United Kingdom, VETisco - is the companyâs veterinary instruments business and MiVetClub & VetShare - two pet buying groups supported by the company. Other than the above, the company also has its own brand MiPet brand of Pet food, therapeutics and associated products.
CVSG Share Price Performance
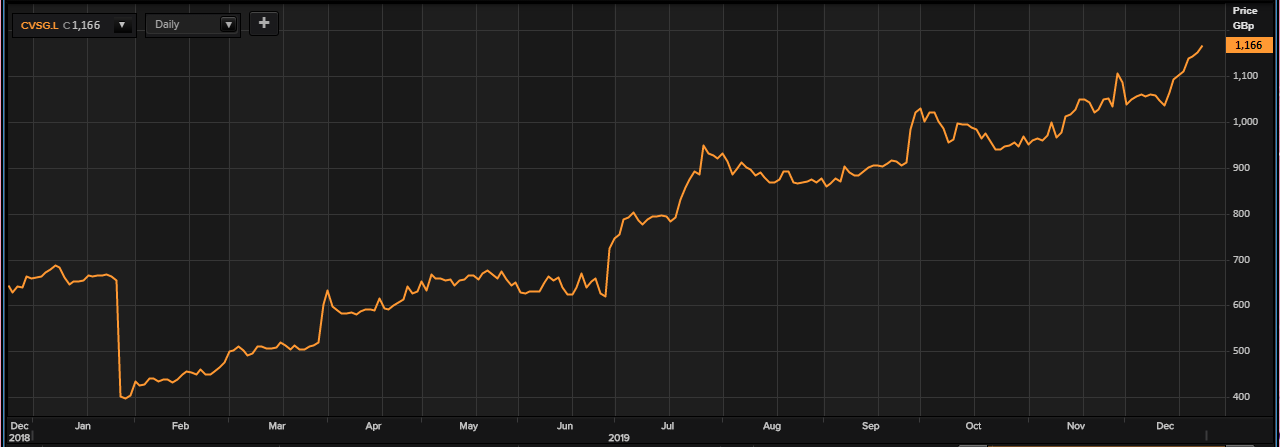
(Source: Thomson Reuters) Daily Chart as on 24-December-19, before the close of the market
As on 24th December 2019, at 12:10 P.M Greenwich Mean Time, while writing, CVS Group Plcâs price of the stock was reported at GBX 1166.00 per stock on the London Stock Exchange, an increase in the value of 1.39 per cent or GBX 16.00 per stock, as opposed to the last dayâs closing price, which was reported at GBX 1150.00 per stock. The companyâs market capitalisation stood at a value of GBP 812.00 million in relation to the present market price of the share of the company.
Reportedly, CVS Group Plcâs stock has given an upside return of around 83.48 per cent in value in the last one year, from the price of GBX 635.50 per stock that the stocks set on December 24, 2018. The CVS Group Plc share has depicted an upside return in the previous half-year, of approximately 79.25 per cent from the price of the stock of GBX 650.50 per stock that the companyâs stock achieved on June 24, 2019. CVS Group Plcâs stock had also gained value by 11.15 per cent, in the previous month from the price of GBX 1049.00 per stock when the markets closed on November 25, 2019.
Companyâs share beta was reported to be at a value of 0.83, which means that the movement of the share of CVS Group Plc, has been less volatile, in comparison with the movement of the comparative benchmark index in the last one year.
Craneware Plc
Craneware Plc (LON:CRW) is an Edinburgh, United Kingdom based healthcare services providing company that is engaged in the development, licensing and providing support using computer software to the core healthcare industry based in the United States of America. The company provides its services to brands such as Southampton Hospital, Firelands regional medical centre, Jupiter Medical centre as well as Ohio Health. The list of the companyâs products includes Chargemaster Toolkit, Pharmacy Charge Link, Trisus Pricing Analyzer, Trisus Claims Informatics, Physician revenue toolkit, Trisus Healthcare Intelligence, Trisus Supply, Supply Assistant and online reference toolkit. The company has a Value Cycle tool that helps improve healthcare facilities their Financial Data, Operational Data as well as Clinical data by addressing various dimensions such as Quality of care, Patient satisfaction and engagement, Clinical outcomes, Operational efficiency as well as Risk management.
CRW Share Price Performance
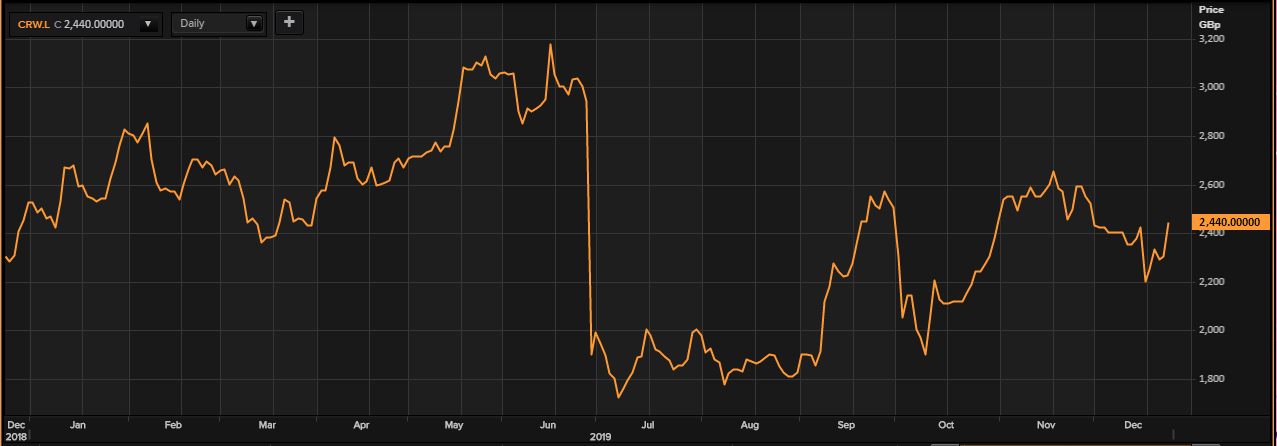
(Source: Thomson Reuters) Daily Chart as on 24-December-19, before the close of the market
As on 24th December 2019, at 12:15 P.M Greenwich Mean Time, while writing, Craneware Plcâs price of the stock was reported at GBX 2440.00 per stock on the London Stock Exchange, an increase in the value of 6.09 per cent or GBX 140.00 per stock, as opposed to the last dayâs closing price, which was reported at GBX 2300.00 per stock. The companyâs market capitalisation stood at a value of GBP 626.00 million in relation to the present market price of the share of the company.
Reportedly, Craneware Plcâs stock has given an upside return of around 7.49 per cent in value in the last one year, from the price of GBX 2270.00 per stock that the stocks set on December 24, 2018. The Craneware Plc share has depicted a downside return in the previous half-year, of approximately 18.94 per cent from the price of the stock of GBX 3010.00 per stock that the companyâs stock achieved on June 24, 2019. Craneware Plcâs stock had also lost value by 2.20 per cent, in the previous month from the price of GBX 2495.00 per stock when the markets closed on November 25, 2019.
Companyâs share beta was reported to be at a value of 1.18, which means that the movement of the share of Craneware Plc, has been more volatile, in comparison with the movement of the comparative benchmark index in the last one year.
Asos Plc
Asos Plc (LON:ASC) is a British online fashion and cosmetic retailer with an active presence in the UK, US and Continental Europe. Apart from being a fashion company, the group calls itself a technology company and is one of the leading fashions stops globally. Around 60 per cent of the products sold are exclusively through its platform, and the company operates its own brand of clothes as well. The companyâs operations are differentiated in three operating segments: Retail sales, Delivery receipts and Third-party revenues.
ASC Share Price Performance
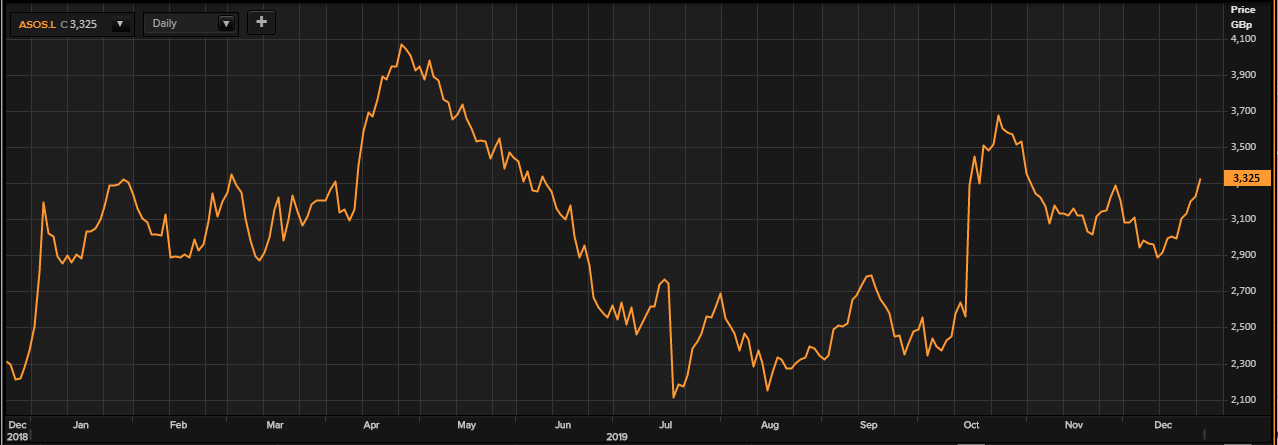
(Source: Thomson Reuters) Daily Chart as on 24-December-19, before the close of the market
As on 24th December 2019, at 12:20 P.M Greenwich Mean Time, while writing, Asos Plcâs price of the stock was reported at GBX 3325.00 per stock on the London Stock Exchange, an increase in the value of 3.13 per cent or GBX 101.00 per stock, as opposed to the last dayâs closing price, which was reported at GBX 3224.00 per stock. The companyâs market capitalisation stood at a value of GBP 2.706 billion in relation to the present market price of the share of the company.
Reportedly, Asos Plcâs stock has given an upside return of around 46.15 per cent in value in the last one year, from the price of GBX 2275.00 per stock that the stocks set on December 24, 2018. The Asos Plc share has depicted an upside return in the previous half-year, of approximately 16.95 per cent from the price of the stock of GBX 2843.00 per stock that the companyâs stock achieved on June 24, 2019. Asos Plcâs stock had also gained value by 5.93 per cent, in the previous month from the price of GBX 3139.00 per stock when the markets closed on November 25, 2019.
Companyâs share beta was reported to be at a value of 1.51, which means that the movement of the share of Asos Plc, has been more volatile, in comparison with the movement of the comparative benchmark index in the last one year.
