


Source: Mike Flippo ,Shutterstock
Summary
- The S&P 500 has broken the major resistance zone on the weekly chart and now prices are getting major support from the Parabolic SAR indicator.
- On the weekly charts, the S&P 500 is trading in a rising wedge formation and the Nasdaq Composite index is trading in an upward channel formation.
- The Nasdaq Composite index price has formed a bearish engulfing candlestick pattern and RSI (14-period) formed a negative divergence on the chart.
The S&P 500 index witnessed a sharp rally from the low of 3,233.94 made on 30 October 2020 to a new lifetime high of 3,950.43 (on 16 February 2021), a gain of ~22 percent in this short span. On the weekly chart, the index has broken out of its upward trend line (orange line in the below chart) at 3,712.50 level and hit a new lifetime high.
S&P 500 Index Weekly Technical Chart
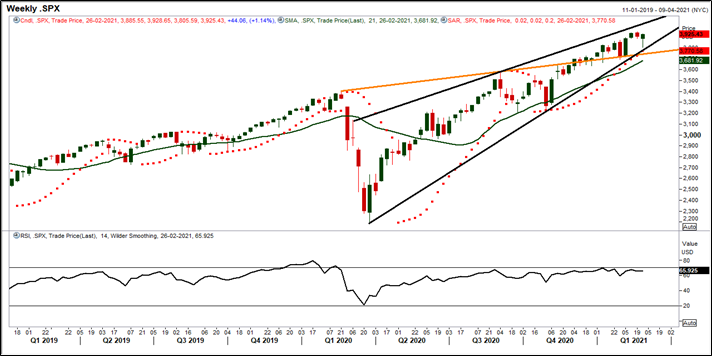
Source: EODHD/Others, Thomson Reuters; Analysis: Kalkine Group
The index is trending upward, forming a series of higher tops and higher bottoms which indicate bulls are still in action. The prices have been trading in the rising wedge formation for the past one year on the weekly time frame chart. Currently , the prices are sustaining above the lower band of the rising wedge formation and if it fails to hold the key support level of 3,770.50, then it might tumble towards the 21-period SMA support level.
Furthermore, the prices are trading above the Parabolic SAR indicator, acting as a crucial support zone for the index. The index is well placed above its 21-period SMA, an important support. Any upside movement from the current levels would be dominated by the bulls and are expected to remain active till the resistance level of 4,008.50, near the upper band of the rising wedge formation. The major resistance level for the index is at 4,008.50 and any move above this level might attract more bullish sentiments . The momentum oscillator RSI (14-period) is trading at ~65 levels, which supports bullish bias for the index.
Nasdaq Composite Index Weekly Technical Chart
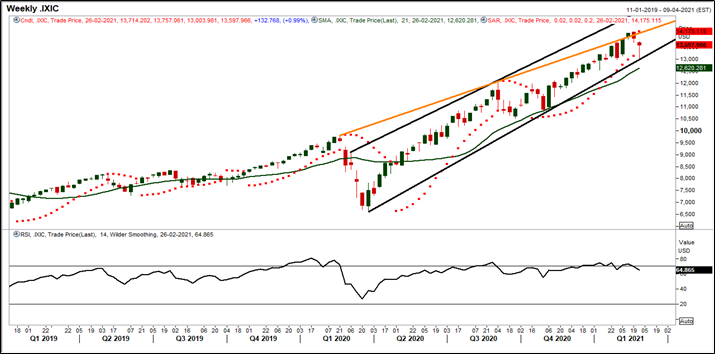
Source: EODHD/Others, Thomson Reuters; Analysis: Kalkine Group
The Nasdaq Composite index prices have been continuously in a bull move from the low of 10,822.57 and recently made a new all-time high of 14,175.12 (on 16 February 2021). Post that, the price has made a low of 13,003.98 (on 23 February 2021), due to profit booking, a decline of ~8.26 percent.
On the weekly chart, the index prices are trading in an upward channel formation for the past one year . Currently, the prices are taking the support of the lower band of the channel and if it manages to hold the immediate support of 13,000, then the prices might trade higher towards the trend line resistance. The major support level for the index is at the 13,000 level and any price action, with some degree of confirmation, below this level might attract bearish sentiments ahead.
Further, the index had attempted to break out of its upward trend line (orange line in the above chart) at 13,877 however, it failed to hold the support zone and prices drifted towards the lower band of the pattern.
The index price is trading below the Parabolic SAR indicator, acting as a crucial resistance zone at the 14,175.11 level. A bearish engulfing (bearish reversal) candlestick pattern is formed on the weekly chart. In addition, the momentum oscillator RSI (14-period) is trading at ~64.86 levels and is forming a negative divergence on the weekly chart, indicating that a correction from here may drift the price lower towards the 21-period SMA support level. Besides, the index price is trading above its 21-period SMA, acting as a crucial support zone at the lower end of the pattern.
Conclusion: Based on the above chart analysis and technical outlook, the S&P 500 index seems to be in the control of bulls. The S&P 500 and Nasdaq Composite are holding the key support zone, but the chart pattern suggests that there might be some action expected in S&P 500 index if the price remains above the support zone or breaks the crucial resistance zone in the coming trading sessions.
