
 AUS
AUS
 NZ
NZ
 UK
UK
 CA
CA
 USA
USA
 IND
IND







Tesla is breaking all records with the stock contouring another record high of USD 695.00 a share yesterday. The EV giant is now all set to see its inclusion in America’s benchmark S&P 500 stock index on Monday, i.e., 21 December 2020.
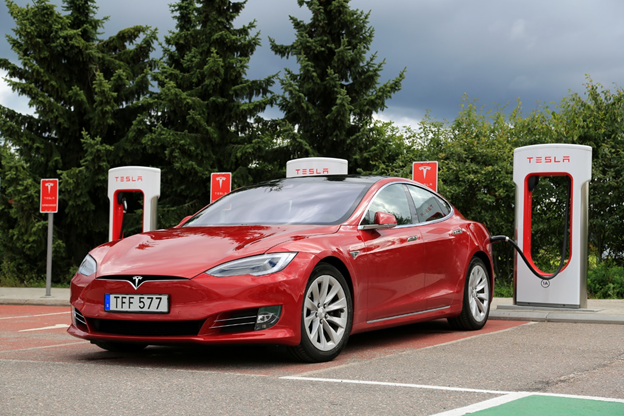
Image Source: Megapixl
The inclusion of Tesla in one of the global benchmarks represent a significant financial milestone. The demand for EV remained resilient in 2020 despite the COVID-19 outbreak.
Furthermore, while the addition of the stock in the S&P 500 is on back of the strong stock performance and the huge market capitalisation that Tesla is now commanding, it could also mean a good ride for ETF funds that passively replicate the index.
However, such funds can also witness a bumpy ride as well as Tesla has been a consistent volatile stock in the recent past.
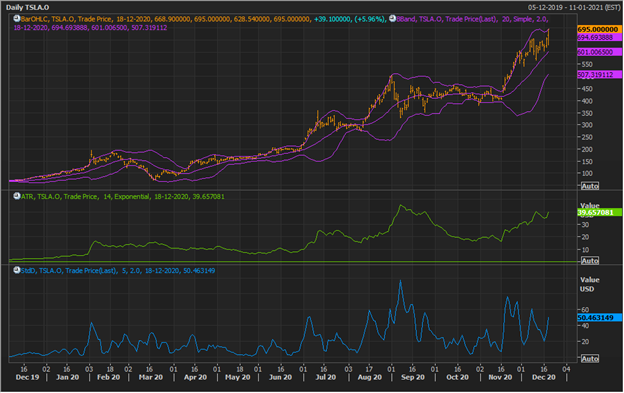
Tesla Daily Chart (Source: EODHD/Others Eikon Thomson Reuters)
On studying the daily chart of the Tesla, it could be seen that in the recent past, Tesla gave a volatility breakout from a symmetrical triangle pattern (consolidation), and since then, has been trading in the upper range or near the +2 Standard deviation of the 20-day simple Bollinger Band®.
Furthermore, it could be seen that the stock has a history of wide expansion in volatility after consolidation, a characteristic which could contribute to the underlying volatility of the S&P 500 index, i.e., VIX, ahead.
Also, on following the Average True Range (ATR) on the past 14-day trailing basis, it could be seen that the majority of volatility in the stock is towards the upside, which might be good news for passive funds tracking the index.
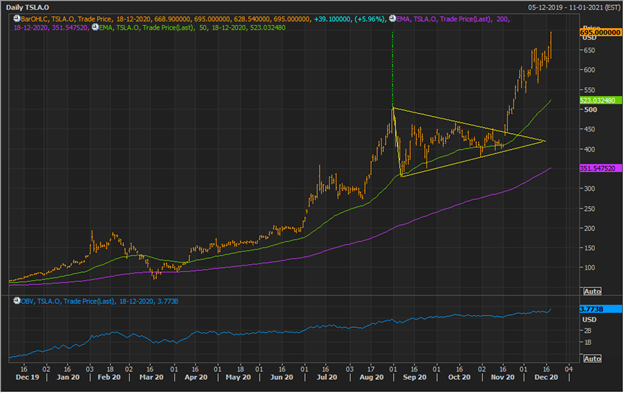
Tesla Daily Chart (Source: EODHD/Others Eikon Thomson Reuters)
Tesla has a history of showing a series of consolidation ahead of any major push.
The stock, which has been under a primary uptrend with prices trading above the 50-day and 200-day exponential moving averages, is now showing a decline in volatility despite a recent rally in price, which could be an early indication of a dilemma of the future move in the stock post the completion of the symmetrical triangle breakout target level and a potential reason for a divergence in volatility (ATR & Standard deviation) against the price action.
The addition into S&P 500 might see fresh set of money chasing the already hot EV stock.
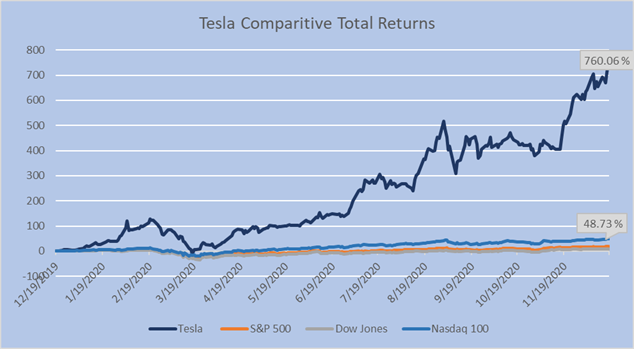
Tesla One-Year Total Returns (Data Source: EODHD/Others Eikon Thomson Reuters)
On the performance counter, over the last one-year, Tesla has delivered a total return of 760.06 per cent as compared to the total return of just 17.86 per cent delivered by the S&P 500. Furthermore, despite being at a record high, Nasdaq with its total return of 48.73 per cent is considerably underperforming Tesla.
Also Read: US Fed Continues to Pump Money, Nasdaq Contours New ATH
