


The US stock market has once again ended at a record high on 16 December 2020, with S&P 500 and Nasdaq 100 both hitting their previous record highs while Nasdaq 100 even establishing a new record of 12,698.11 (intraday high).
One of the primary reasons behind the rally in the US stock market was the indication from the federal reserve to keep the ultralow interest rate environment going to support the economic growth.
In its statement, the Fed once again sounded optimistic on the domestic recovery; however, emphasised that the future recovery would depend upon how the United States would handle the current situation. The Fed Chair Jerome Powell held the fund rates in the range between 0 to 0.25 per cent as Washington tries to hammer out an agreement concerning another round of fiscal stimulus for the market.
Furthermore, Fed increased its GDP forecast for 2020-2022 while bringing no change to the USD 120 billion per month stimulus package, ensuring that the prevailing low-interest rates environment along with monetary support continue to pull the economy from the dark.
The indication from the federal reserve over monetary free flow in the market once again cheered the bulls, and the Nasdaq 100 rose to another record high.
What are the Charts saying?
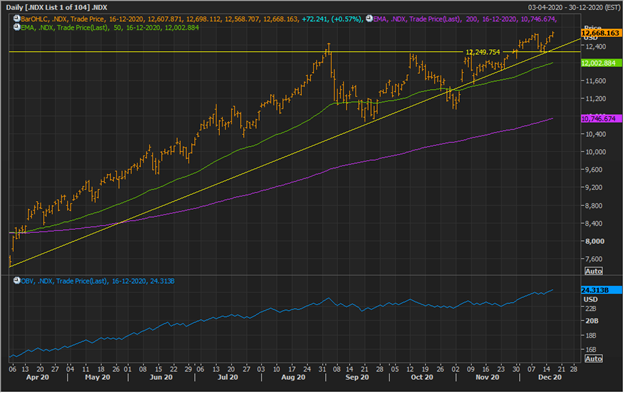
Nasdaq 100 Daily Chart (Source: EODHD/Others Eikon Thomson Reuters)
The index rose above the horizontal resistance line of 12,249 while gathering volume support. At present, the index is trading above the 200-day and 50-day EMAs, suggesting that the major trend in the index is an uptrend.
The current support for the index is at 12,249, as it is the point where the upward sloping trendline is crossing the horizontal support level.
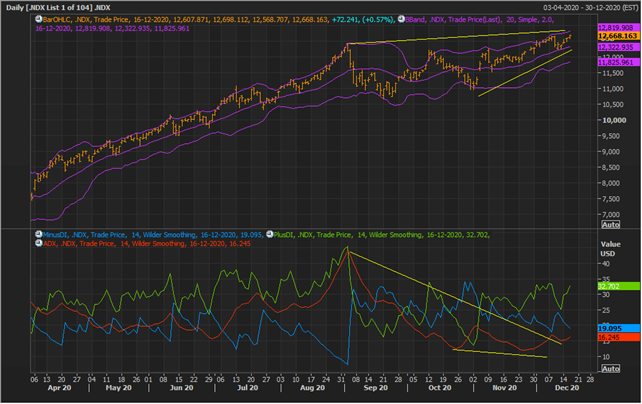
Nasdaq 100 Daily Chart (Source: EODHD/Others Eikon Thomson Reuters)
On the daily charts it can be observed that the index gave a volatility break around mid-October 2020 with prices crossing the +2 Standard Deviation of the 20-day simple Bollinger Band®.
However, the index quickly retraced the mean of the band, negating the efforts from bull to take the price higher; and since then, the index has been trading in the band range of +2 Standard Deviation to -2 Standard Deviation.
Thanks to this tapering momentum in price, the ADX has started sloping downwards, creating a bearish divergence. However, the plus DI has once again moved above the minus DI, reflecting that the majority of closes are above their previous close (as also demonstrated by the current uptrend).
Furthermore, the downward sloping ADX is indicating that the current volatility in the past 14-day is towards the downside. Therefore, the setup might capture the attention of bulls and bears.

Nasdaq 100 Weekly Chart (Source: EODHD/Others Eikon Thomson Reuters)
On applying the Ichimoku Cloud on the weekly chart, it could be seen that the index is currently trading above Span A, which itself is above Span B, suggesting that the primary trend is an uptrend. Furthermore, the conversion line (dark blue) is trading above the base line (light blue), establishing a bullish cross suggesting that the short-term sentiment is bullish in nature.
The 12,26, and 9 days MACD is showing a positive cross with signal line trading above the base line. However, the 14-week RSI is showing a slight variation.
In a nutshell, the major trend for the index is an uptrend, but some of the technical indicators are showing divergence over the recent weakness in prices.
Furthermore, the volatility of the index could increase over the coming week due to the approaching annual rebalancing of Nasdaq 100 on 21 December 2020.
