


_07_03_2026_03_50_21_133108.jpg)

Source: Daniel Fung, Shutterstock
Summary
- PVH Corp. (NYSE:PVH) prices almost quadruple in the 8 months (from March 2020 to January 2021) and made a new 52-week high.
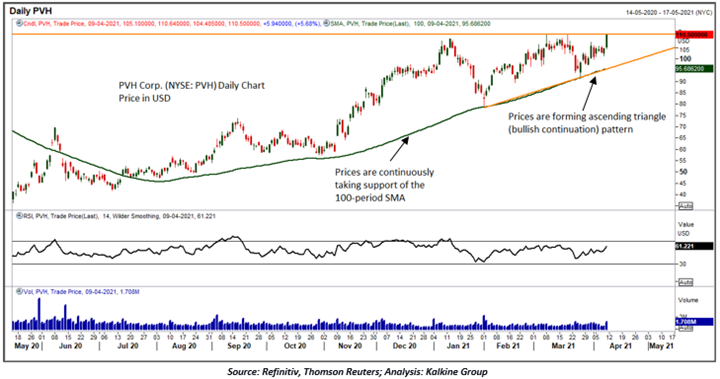
- On the daily time frame chart, PVH Corp. prices are forming ascending triangle pattern (bullish continuation).
- On the weekly time frame chart, PVH Corp. prices are sustaining above a downward sloping trend line breakout level for the past 5 months.
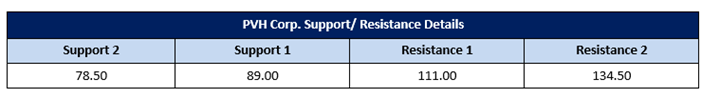
- Currently, the PVH Corp. prices are trading around the crucial resistance level of USD 111.
PVH Corp. (NYSE:PVH), formerly known as the Phillips-Van Heusen Corporation has almost quadruple in the 8 months and made a fresh 52-week high. The stock price rallied from the low of USD 28.40 made in the latter half of March 2020 to the high of USD 108.84 tested in January 2020.
For the past 3 months, prices are consolidating on higher levels with a positive bias. On Friday, the stock prices closed at USD 110.50, up by 5.86% and outperformed some of its peers, as Gap Inc. (NYSE:GPS) rose by 3.28%, Ralph Lauren Corp. (NYSE:RL) rose by 3.20% and V F Corp. (NYSE:VFC) rose by 2.20%.
Let us now analyze PVH Corp. for a short-term outlook:
On the daily time frame chart, PVH Corp. prices are consolidating with a series of higher lows and similar highs for the past 3 months. Prices are forming ascending triangle pattern (bullish continuation). The recent upward movement is also accompanied by the volume and seems supportive for further positive movement. However, the prices are trading around the major resistance level USD 111.00 and a downside movement from the current levels might drift prices lower towards the 100-period simple moving average (SMA).
On the weekly time frame chart, it can be seen that the prices are sustaining above a downward sloping trendline breakout for the past 5 months. Prices were consolidating with a positive bias and recently started to move upside. Volume is also showing an increasing trend and conferring higher market participation at the current levels. However, like seen in the daily chart, prices are facing major resistance of USD 111.00 on the weekly chart as well.

Technical Indicator Analysis:
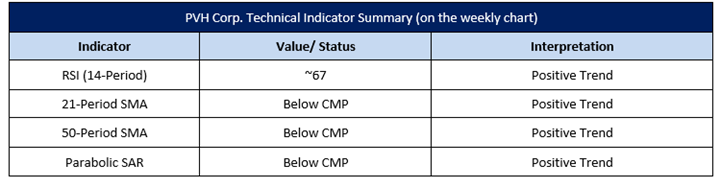
The leading indicator RSI (14-period) is trading at ~67 levels, indicating a positive trend for the stock. Prices are continuously taking support of the trend-following indicator 21-period SMA and forming a positive crossover with another trend-following indicator 50-period SMA. Parabolic SAR is also sustaining below CMP and appears supportive of the stock prices. The summary of technical indicators is as below:
After analyzing the current price action coupled with the technical indicator, PVH Corp. prices seem to be trading at a crucial level as prices are getting support from several technical indicators, but at the same time facing major resistance at USD 111. An upside move from the current level may end the consolidation phase of the stock; however, a downside move might induce a fresh correction in the stock.
