


After the cryptocurrency market crash on Wednesday, May 19, Bitcoin (BTC) has settled at its support level of US$ 38,000 for the last two trading days. However, crypto analysts have varied resistance level predictions for the volatile token.
Bitcoin, the largest as well as the trendsetting token of the crypto market, plunged to almost US$ 30,000 and then rebounded to US$ 40,000 apiece within a span of two hours on Wednesday.
While BTC token has been trading in the range of US$ 38,000 to US$ 42,500 apiece for the last 48 hours, the spot price is still well below expectations. The overall crypto market cap is at US$ 1.76 trillion, down as much as US$ 600 billion month-to-date (MTD).
Meanwhile, analysts have keenly been marking potential resistance and support levels if a fresh rally or a new crash takes hold of the crypto market.
‘Buy the dip’ or ‘buy at discount’ calls for Bitcoin have been overflowing on social media platforms. But right now, investors are turning all their attention to two price levels: will Bitcoin hit the red floor or green ceiling?
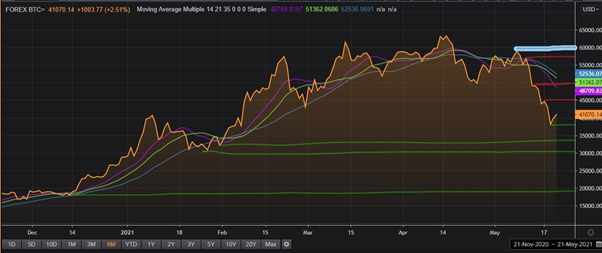
BTC/USD's Six-Month Trajectory Against Moving Average Multiple. Support Levels (Green lines) & Resistance Levels (Red lines). Source: EODHD/Others
What Will The Next Resistance & Support Levels Be For Bitcoin?
The first resistance level is US$ 45,000, around US$ 5,000 or 12.5 per cent above Bitcoin’s current spot price of US$ 40,000 apiece.
After analyzing the moving average multiple, Bitcoin prices are still down by 20 to 30 per cent. Its second resistance level could be at US$ 51,000, overlapping its 21-day moving average.
The third and fourth thresholds have been placed at US$ 57,500 and US$ 60,000, respectively. If the crypto token price breaches the fourth ceiling, it could achieve a record high peak. It was marching at nearly US$ 38,000 apiece on Friday, May 21 (11:25AM EST).
Let see the four support levels for the bear crypto market.
Bitcoin may consolidate and hit at the bottom, down to the last five-month range. The uptrend continues intact above US$ 35,000 for a while, although the market is very sensitive and volatile, and any small development could cause sharp swings and pullbacks. If the giant electronic token tumbles below the US$ 30,000-mark, it could witness a steep dip to a US$ 20,000-mark.
A Glance At Ethereum’s Potential Technical
Ethereum, the second-largest virtual token, is trading in the range of US$ 2,400 to US$ 3,000 apiece. The blockchain network platform has been counting big on its 2.0 version, which could help it in its competition with Bitcoin.
If the crypto market crashes again, Ethereum could take support at US$ 1,500 apiece. If it crosses its spot price of US$ 3,500, then it might surge to an all-time high price.
The coin was trading at US$ 25,000 on Friday, May 21 (11:30AM EST).
The above constitutes a preliminary view and any interest in stocks should be evaluated further from investment point of view.
