


Highlights
- Moving average helps to gauge the direction of Bitcoin (or any other security).
- Traders can also use RSI to help determine when Bitcoin has risen too much or has fallen too much, to take reversal trades.
- No indicator is infallible, and traders must manage their risk at all times, while trading Bitcoin or other security.
Trading in Bitcoin or any other cryptocurrencies is a different ball game. The extreme volatility of these new-age coins can make them difficult to trader even for some experienced traders. With Bitcoin having marked a new all-time high of almost US$67,000 on 20 October 2021, the interest in trading Bitcoin has also increased.
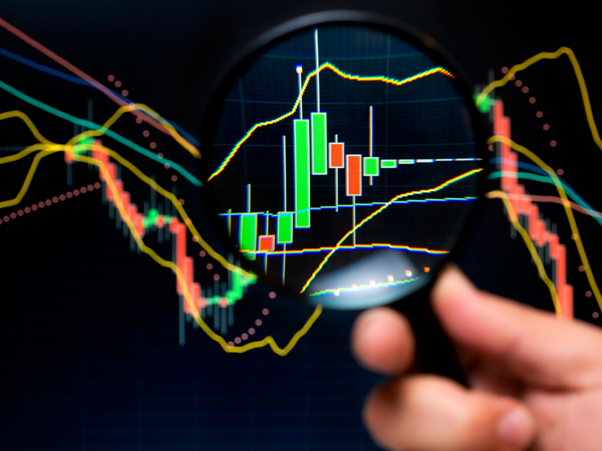
Image Source: © Sbotas | Megapixl.com
If you are a first-timer in the crypto space or already trading Bitcoins but still facing difficulties to gauge its erratic moves, then find below a list of some useful technical indicators to help you to navigate the markets.
Read More: What is the significance of technical analysis in portfolio building?
- Moving average
Moving average is one of the most popular and widely used technical indicators worldwide. From beginners to pros, everyone has used a moving average at least a few times. It is simply the arithmetic mean of the past (n) number of closing prices on a rolling period basis, which is plotted on the same price chart of the underlying security.
Moving average helps you to gauge the current trend objectively, without any ambiguity or discretion, giving traders a clear view of the direction. If Bitcoin (or any other security) is trading above their moving average, the trend is considered to be positive and vice versa. The number of periods for which the average is to be calculated is always up to the trader.
- Relative Strength Indicator (RSI)
RSI, developed by Wells Wilder, is also one of the most popular technical indicators. While moving average helps to gauge the trend direction, RSI helps to gauge the extreme zones where the security has become overbought/oversold.
If RSI is trading below 30, the security is said to be oversold, while RSI readings above 70 signify that the security is overbought. These levels help to anticipate a reversal in the security, which is helpful for a mean-reversion trade. RSI can be helpful in picking up short-term peaks and troughs in Bitcoin.
- Average Directional Index (ADX)
ADX is used to determine the strength of the underlying trend on either side. If you face difficulty in gauging if the current trend of Bitcoin is strong or weak, then ADX is a handy tool. It is a calculation that gives readings based on how strong the trend is.
Higher the reading, higher would be the underlying trend and vice versa. These data points are joined to form a smooth line, which helps in the visual representation of the strength reading. The difference between ADX and moving average is, that while the latter gauges the trend, the former determines the strength of that trend.
Bottom Line
To trade Bitcoin effectively, some technical indicators can be useful to objectively gauge parameters on which a trader relies on. For example, parameters like trend, overbought/oversold conditions, strength of the trend, etc, can all be measured, giving traders a crystal clear view of the underlying security, aiding them in effective decision making.
One thing to note is, although these indicators do help, they are not foolproof. These are just mathematical calculations and, therefore, traders must manage their risk at all times while trading Bitcoin or any other security.
