


Highlights
- Bitcoin’s resistance level is a technical indicator which may or may not be holding any clues.
- Moving averages rely on past price data, which in the case of Bitcoin can be very wide-ranging due to the underlying ultra-volatility.
- Technical indicators fail to take into account qualitative aspects like SEC’s approval of a Bitcoin ETF.
A lot is being talked about Bitcoin’s resistance level.
The most popular crypto, with a share of over 45 per cent in the cumulative market cap of the cryptocurrency universe, Bitcoin, is like no other regular listed stock. By contrast, Bitcoin and altcoins are the latest asset class with their own unique features. Today, let’s find out the answer to what is Bitcoin’s resistance level, if any.
 Source: Pixabay.com
Wait, what is ‘resistance level’?
It is a price level which the asset finds difficult to breach. This difficulty usually emanates from supply-side pressures. As the price touches a certain level, sellers are more inclined toward cashing out. This is because they believe it might be the best time to book a profit on the investment.
Also read: Can Bitcoin be termed as the ‘asset of the century’?
Resistance level is a technical indicator that involves the use of past price data and its analysis. More than a long-term gauge of price movement, it is a short-term indicator because past data can be irrelevant in the long term. Listed stocks are usually analyzed on past data so that traders can get a clue of the price that is the best for an exit.
However, many stocks defy this so-called resistance level with not much stress. For example, Tesla’s stock has rallied over the past one and a half years, and all the pointers around the resistance level of this stock just failed to reward traders that relied on them.
Moving average plays a key role in identifying resistance level. It is the arithmetic mean of price over the past given number of days, for example 50 days. Moving average is said to weed out short-term variations from the price.
Bitcoin’s price fluctuations
The issue with finding Bitcoin’s resistance level is that the asset isn’t just volatile, it is hyper-volatile. At the beginning of the year 2021, BTC was priced at nearly US$29,000. Just a month back from that date, it was priced at nearly US$18,800 on December 1, 2020. Within a week into 2021, BTC reached nearly US$40,000.
The above price data reveals that BTC more than doubled within fewer than 40 days.
Also read: Can Bitcoin investment fund festive spending this holiday season?
And this was not a one-off event of such steep price variation in Bitcoin. The fall in price has also been in the same breath on multiple occasions.
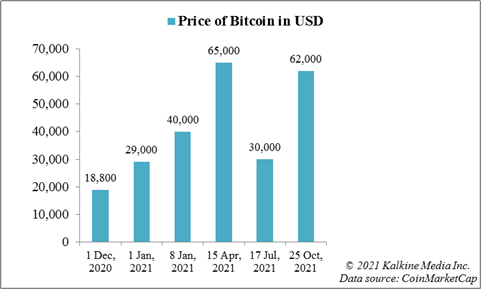
By mid-April, BTC reached a peak of nearly US$65,000, and then began the downward slide in the wake of China’s crackdown and power consumption concerns. By around mid-July, BTC fell below US$30,000 and then was the rally, although not uninterrupted, which as of now has BTC sitting at nearly US$62,000.
BTC technical indicators
As of now, Bitcoin’s 50-day simple moving average is nearly US$51,000, according to TradingView. The 200-day simple moving average is nearly US$45,200.
Neither of these two are anywhere near the lows of mid-July 2021. The moving average of BTC virtually fails to take into account the extreme volatility that has dominated prices in 2021.
Also read: Is investing in altcoins better than Bitcoin?
Non-technical indicators
More than technical indicators that rely solely on past performance of the stock, it is qualitative indicators that can help roughly forecast at least the short-term price of Bitcoin and other cryptos.
Take for example the recent rally in Bitcoin which helped it breach the mid-April highs. The surge was fueled by the launch of the first Bitcoin exchange-traded fund (ETF) in the US. Crypto backers had been keen on such an offering that could take Bitcoin at least a little closer to the SEC-regulated world.
Before this, it was the crackdown on mining, coupled with the crackdown on the Binance crypto exchange in multiple jurisdictions that put pressure on BTC’s price. This indicates that more than technical indicators, it is the non-technical aspect that impacts BTC.
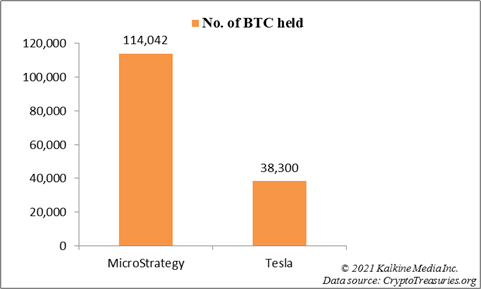
Also read: MicroStrategy bitcoin holding soars, dwarfs Tesla's
However, not all Bitcoin headlines generate the same surge or slide. For example, El Salvador’s Bitcoin adoption as a legal tender was largely ignored by crypto enthusiasts. No major price change followed the announcement. Similarly, when the CEO of MicroStrategy tweeted last month about having bought 5,050 more Bitcoins, the price did not fluctuate much.
What is Bitcoin’s resistance level?
Finally, there has to be an answer. It is probably that Bitcoin has yet to become a pure replica of listed stocks before we can decide its true resistance level. For now, the term may influence buying decisions of some crypto enthusiasts; however, seasoned traders may not be banking much on it.
The fundamentals of listed companies are easy to understand. They include market share, revenue growth, competition and similar quantifiable elements. Bitcoin’s fundamentals are hard to quantify. Nonetheless, the moving average is easy to arrive at given it is just the arithmetic mean of easily available data – the price.
Also read: Can Bitcoin end 2021 with a price tag of $100,000?
Bottom line
Although there is a resistance level of Bitcoin that can be calculated by relying on moving average, it may not be the best investment strategy. That’s because the resistance level is so technical that it fails to factor in the most important elements that just cannot be quantified. Imagine the SEC finally deciding on how to regulate cryptocurrencies, or the buzz around Tether not holding the US$69 billion in reserves emerging as true.
Any big news can impact the price of Bitcoin and technical indicators may not be even close to what then unfolds. The price of Bitcoin could breach US$100,000 by the end of 2021 or perhaps dip from hereon due to profit booking pressures.
