
 AUS
AUS
 NZ
NZ
 UK
UK
 CA
CA
 USA
USA
 IND
IND








Bitcoin prices have smashed through the USD 20,000 mark to reach a new record high - the blistering rally in Bitcoin has delivered a one-year return of 190 per cent. The recent rally in the cryptocurrency has been well-supported by large institutional buying and bullish market sentiment.
Also Read: Bitcoin At an All-Time High Outperforming All Asset Classes, Why are investors Gung-ho?
The prevailing low to negative interest rate along with considerable uncertainty around risky assets has prompted large institutional buyers to look for alternative assets to hedge against the global risk, making Bitcoin a part of their asset allocation.
Apart from that, better performance against gold has also supported large buying for the crypto currency, leading to an impeccable rally.
However, after showing a strong rally and a large, accelerated move, Bitcoin prices are showing slight divergence with some of the leading technical indicators.
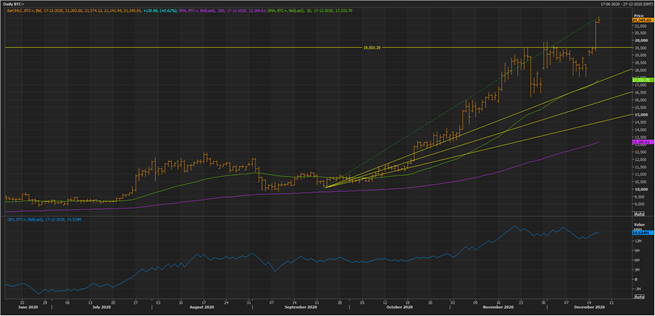
BTC Daily Price Chart (Source: EODHD/Others Eikon Thomson Reuters)
On the daily chart, it could be seen that the currency accelerated in an uptrend after showing a weak downside move for a while. Post that, the rally crossed its previous all-time high, which could now act as a point of primary support for the currency.
Also Read: Hedge Funds to Hollywood Celebrities Fancy Bitcoin
At present, the currency is trading above the 50-day exponential moving average and 200-day exponential moving average (EMA), suggesting that the major trend is an uptrend.
On connecting the starting point of the acceleration with the recent top established by the currency, the support level could be projected with 1/3 Fibonacci projected level overlapping with the 50-day EMA. The same level could act as the secondary support for the bulls.
However, the current trend needs to be closely tracked to check the bull sentiments as some leading technical indicators are pointing towards the weakening of the uptrend.
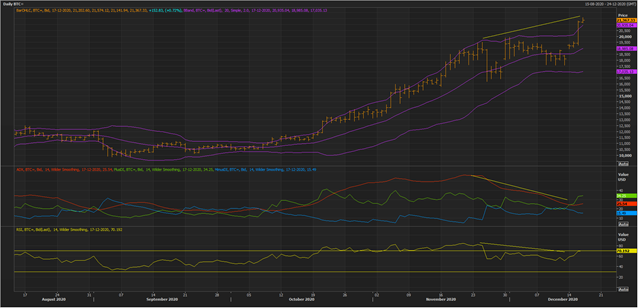
BTC Daily Price Chart (Source: EODHD/Others Eikon Thomson Reuters)
Upon studying the directional and momentum indicators it is observed that the 14-days RSI is showing a slight divergence with the price action. Furthermore, the spread between Plus DI and Minus DI has reduced, establishing a point of crossover, which as per the teachings of J. Welles Wilder. Jr. could be used as a stop loss zone by traders.
Furthermore, the ADX is now sloping sharply down as compared to the price action, which is establishing new highs, creating a divergence, and this should draw the attention of bulls and bears.
However, the currency has given a volatility breakout over extreme bullish sentiments with prices breaching the +2 Standard Deviation of the 20-day Bollinger Band ®.
Apart from these two leading indicators, the price and volume-based OBV is also showing a slight divergence with the price action, suggesting that the recent rush in not well-backed by large participation.
Currently, the -2 Standard Deviation of the band is touching the price point where Wilder’s DIs are showing a crossover; thus, the point might act as a short-term decisive level.
