


Summary
- TerraCom Limited (ASX:TER) has indicated its stakeholders that FY2021 coal production could surpass the record FY2020 production of 14.55 million tonnes.
- CEO Danny McCarthy stated that annualised estimates indicate the same and the acquisition of Universal Plc has bolstered the coal production profile of the Company.
- The market seems to be reacting positively over the announcement with the stock climbing 4 per cent above the previous close on day’s session on 3 September 2020.
- However, on the technical counter, the stock resumes its downside trail.
- TER on charts.
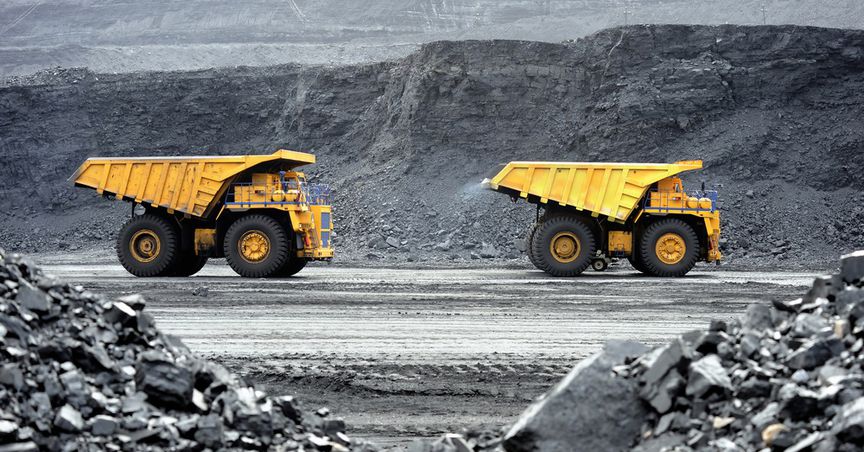
TerraCom Limited (ASX:TER) released coal sales figures for the FY2021 to the end of August 2020 and suggested that despite the ongoing economic meltdown on a global scale on account of the COVID-19 outbreak, it maintained consistent production and therefore coal sales.
- The Company managed tonnes total export reached 563k for the period 2021FY to the end of August 2020 while the managed tonnes on the domestic counter reached 1,073k, leading to total managed coal of 1,636k.
On an annualised basis, the managed coal reached 9.81 million tonnes during the period.
- Likewise, the equity coal export reached 474k for the period while the equity tonnes on the domestic counter reached 589k, leading to total equity coal of 1,063k.
On an annualised basis, the equity coal reached 6.37 million tonnes for the period.
Commenting on the performance, CEO Danny McCarthy stated that based upon an annualised assessment, TER is well-positioned to exceed the annual coal sales achieved during FY2020 of 9.98 million tonnes.
In the recent past, the Company acquired Universal Coal Plc, which has bolstered the coal sales profile while giving an impetus to contracted sales with leading South African power utility Eskom, which in turn, provides the Company with a natural hedge against the export coal sales market.
FY20 Financial Highlights
The Company reported an underlying EBITDA of $79.6 million for FY2020 over a record coal sales of 9.98 million tonnes, which remained 11 per cent up against the previous corresponding period (or pcp).
The coal production for the period climbed to 14.55 million tonnes to mark a record value, up by 26 per cent against pcp.
Market Reaction and Technical Purview
As mentioned above, the Company has now notified its stakeholders that FY2021 production could surpass the record production logged in FY2020, due to which the stock of the Company seems to be picking a slight market interest to trade in positive territory during the trading session on 3 September 2020.
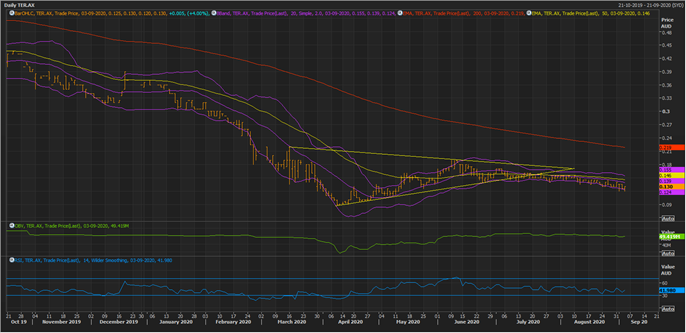
TER on a Daily Chart
Just like many coal mining stocks across the global front, TER is showing a major downtrend on a daily chart with prices trailing downside from the top of $0.700 (intraday high on 27 March 2019). The stock witnessed a record low of $0.088 (intraday low on 8 April 2020); however, has recovered since then slightly with a recent peak of $0.190 (intraday high on 11 June 2020).
TER Daily Chart (Source: EODHD/Others Eikon Thomson Reuters)
On following the daily chart, it could be seen that the primary trend in the stock is a downtrend with the stock trading below its 200-day and 50-day exponential moving average.
- In the recent past, the stock entered an intermediate uptrend; however, bearish sentiments dominated the front, and the stock resumed its downward course with the emergence and breakdown out of a symmetrical triangle formation.
- The breakdown of the symmetrical triangle post attempting a recovery suggests that bearish sentiment currently prevails.
- Furthermore, post the breakdown below the triangle, the stock has entered a narrow range of trading.
- The stock price has now slipped below the -2 Standard Deviation of the 20-day simple Bollinger band, suggesting that the stock is losing upside momentum, which could attract bears interest.
- On the resistance counter, the mean value of the 20-day simple Bollinger band, which is overlapping with the 50-day exponential moving average; thus, is decisive in nature, should act as a primary hurdle for the stock.
- A breach above the primary hurdle could attract bulls, which might engage the stock in a sentiment tug-of-war, and should be monitored.
- Additionally, the secondary hurdle would be around the +2 Standard Deviation of the Bollinger band followed by a major hurdle of 200-day EMA, above which, the stock could once again enter the secondary uptrend.
- The 14-day Relative Strength Index, along with the On Balance Volume, is moving in tandem with the price behaviour.
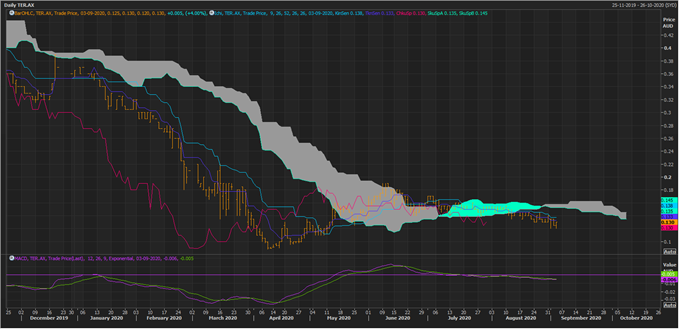
TER Daily Chart (Source: EODHD/Others Eikon Thomson Reuters)
On applying Ichimoku Kinko Hyo on the daily frame, it could be seen that the stock is currently trading below Span A, which itself is below Span B; thus, reflecting that the major trend is a downtrend.
- Furthermore, the conversion line and the base line is showing a negative crossover below Span A, reflecting the dominance of bears on the front.
- The 12,24,9 MACD indicator is also showing a negative signal.
In a nutshell, while the stock is demonstrating a positive market interest over the indication of a record high production for FY2021, the major trend is a downtrend, and TER has a long way to cover before it could attract large bullish participation, which could be inferred from the technical analysis of the stock.
The stock of the Company last traded at $0.130 (as on 3 September 2020 15:08 AEST), up by 4 per cent against its previous close on ASX.
