
.jpg)


Summary
- The global oil demand for 2021 is forecasted to be higher than the last year.
- WTI Crude Oil price made a 13-month high.
- The Crude oil price has broken the crucial resistance level and getting support from the 21-period simple moving average.
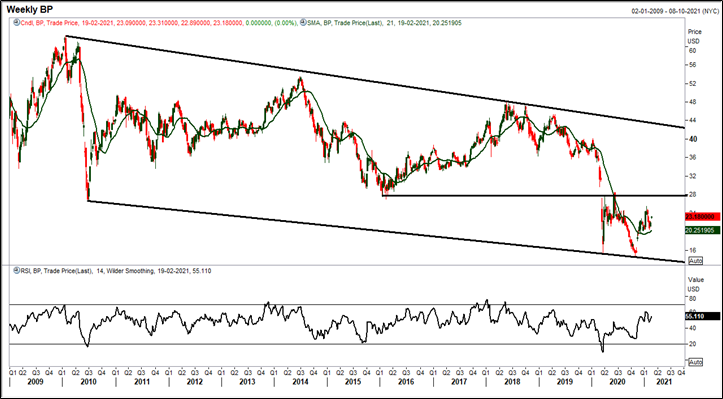
- On the weekly time frame chart BP Spon ADR is trading in a falling channel formation.
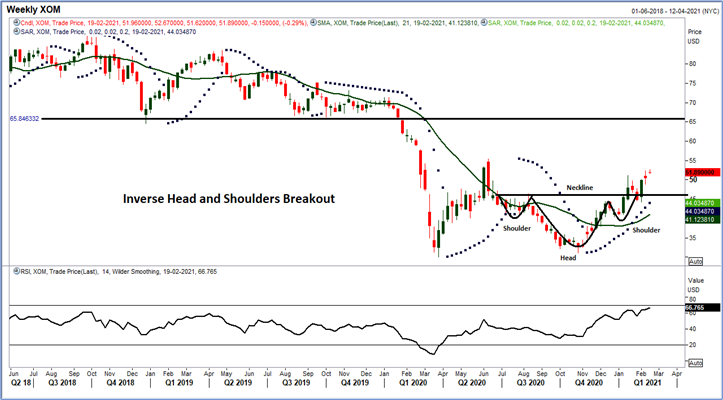
- Exxon Mobil Corp. breaks out of an inverse head and shoulders pattern and prices are getting crucial support from the 21-period simple moving average.
In the last couple of weeks WTI crude oil prices have surged on account of a production cut that was announced by the OPEC+ members coupled with a deep halt in the U.S. South that shut wells and oil refineries in Texas. World crude oil demand in 2020 declined from the previous year and stood at 90.01 mb/d, around 9.75 mb/d lower than 2019 numbers.
According to OPEC data, world crude oil demand for 2021 is forecasted to be 5.9 mb/d higher than the last year. The details of world oil demand and supply balance for the last 4 years is stated as below:

Data Source: OPEC
Look at Crude Oil Prices Through Charts
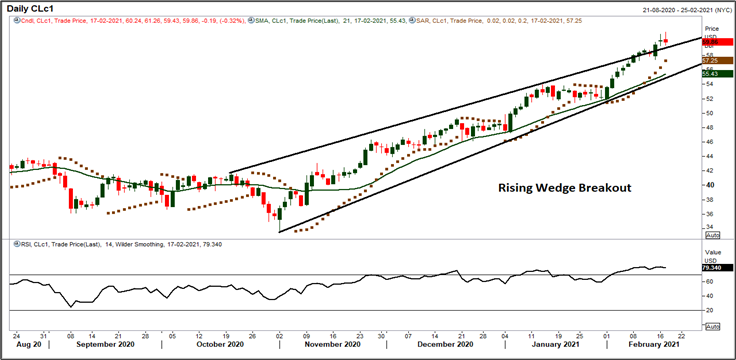
On the daily charts, the WTI Crude Oil price broken out of a rising wedge pattern at USD 58.80 level , post which that the price has touched the 13-month high of USD 62.27 on 18 February 2021. Price has gained ~85 percent from November 2020 low to the present high of USD 62.27. The crude oil price is on a upward trajectory, forming a series of higher tops and higher bottoms which indicate bulls are still in action.
WTI Crude Oil Daily Technical Chart
Source: EODHD/Others, Thomson Reuters; Analysis: Kalkine Group
The prices are sustaining above the upper band of the rising wedge pattern. If the bulls fail to hold the above support level of USD 58.80, then the price might tumble towards the lower trend line. Moreover, the price is trading above the 21-period simple moving average (SMA), acting as a crucial support zone at the USD 55.43 level.
Further, it is well placed above its Parabolic SAR indicator, providing strength to the trend. However, the momentum oscillator RSI (14-period) is trading in the overbought zone at ~72 levels, indicating that a correction from here may find participation pushing the price lower towards the support zone. The major resistance level for the crude oil price is at USD 62.55 level and any sustainable move above this level might attract more bullish sentiments for the prices.
BP bulls can take it past the resistance levels?
Source: EODHD/Others, Thomson Reuters; Analysis: Kalkine Group
BP PLC (NYSE:BP) has climbed almost ~73 percent from its low of USD 14.75 in October 2020, to a high of USD 25.55 levels on 14 January 2021. The stock price has been trading in multi-year falling channel formation on the weekly chart. Currently, the price is approaching the horizontal trend line resistance of USD 27.35 level. In the short run, if the stock price sustains above the resistance level of USD 27.35 then bulls may dominate and are expected to remain active till the next resistance level of USD 34.80.
Further, the price is trading above the 21-period SMA, which indicates bulls have the upper hand in the price action for the short run. The momentum oscillator RSI (14-period) is trading at ~55 levels, which indicates that bulls still have some action left.
Exxon Mobil Corp. coming out of an inverted Head and Shoulders Pattern
Source: EODHD/Others, Thomson Reuters; Analysis: Kalkine Group
On the weekly charts, Exxon Mobil Corp. (NYSE:XOM) has broken out of an ‘Inverse Head & Shoulders’ (bullish reversal) pattern at USD 46.50 level , and touched a 7-month high of USD 53.27 on 17 February 2021. After consolidating in the range of USD 31.20 - 46.50 for more than 7 months, the price registered a decisive breakout on the upside that suggests a change in trend from bearish to bullish.
Besides, the stock price is trading above its 21-period SMA, acting as a crucial support . The stock is well placed above its Parabolic SAR, which appears positive for the uptrend. Furthermore, the momentum oscillator RSI (14-Period) is trading at ~66 levels, which supports a bullish stance for the stock.
The stock prices are trading in the double bottom formation for the last one year and currently, the price is approaching the neckline of the double bottom formation at 55.36 level. Now, the upside resistance is at USD 55.36 level and in the short run, if the stock price sustains above the neckline breakout level of USD 55.36 then bulls might dominate and might remain active till the next resistance level of USD 65.84, near the horizontal trend line.
Based on the above-presented demand and supply scenario and technical outlook, the WTI crude oil seems to be in an uptrend. Currently, the crude oil prices are moving strongly holding the key support zone. The chart patterns suggest that there might be some action expected in BP and XOM if the price remains above the support zone or breaks the crucial resistance zone in the coming weeks.
