


Source: Rangsarit Chaiyakun, Shutterstock
Summary
- Natural Gas price is trading in a falling channel formation on the daily time frame chart and getting major support from the 50-period SMA.
- Natural gas prices are trading above the crucial upward sloping trend line support on the daily chart.
- Antero Resources Corporation’s price made a 52-week high and delivered multifold returns in the last six months.
- Energy Transfer LP has broken out an inverse head and shoulders pattern and prices are getting crucial support from the Parabolic SAR indicator.
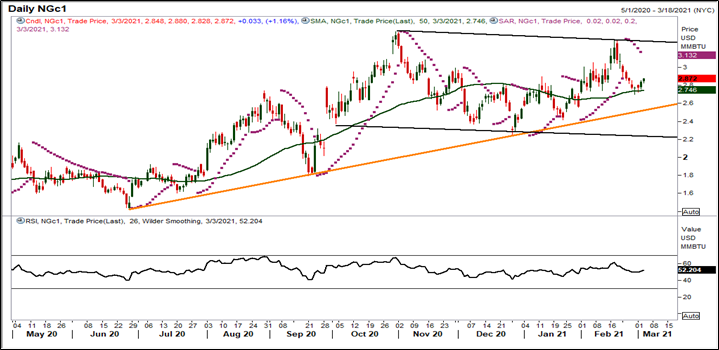
The NYMEX Natural gas has climbed almost ~49 percent from its 28 December 2020 low of USD 2.238 to a high of USD 3.316 levels made on 17 February 2021. The analysis of the current chart structure shows that the prices have been under pressure and drifted lower from the high of USD 3.316 to the recent low of USD 2.697 on 26 February 2021. The positive sequence of higher tops and higher bottoms is intact on the daily chart.
Natural Gas Daily Technical Chart
Source: EODHD/Others, Thomson Reuters; Analysis: Kalkine Group
The Natural gas prices are trading in a falling channel formation for the past six months on the daily chart. Currently, the prices are sustaining above the lower band of the falling channel pattern. Now, it is approaching towards the upward sloping trend line (orange line in the above chart), with the lower support of USD 2.574 level. If the price sustains above the support level of USD 2.574 then bulls might dominate and are expected to remain active till the next resistance level of USD 3.132, near the Parabolic SAR Indicator. Any sustainable move above USD 3.132 levels might attract more bullish sentiments and push the prices towards the USD 3.316 level, near the upper band of channel formation.
, The price is trading above the 50-period simple moving average (SMA) Moreover, momentum oscillator RSI (14-period) is trading at ~49 levels, which indicates a neutral to a positive trend for Natural Gas.
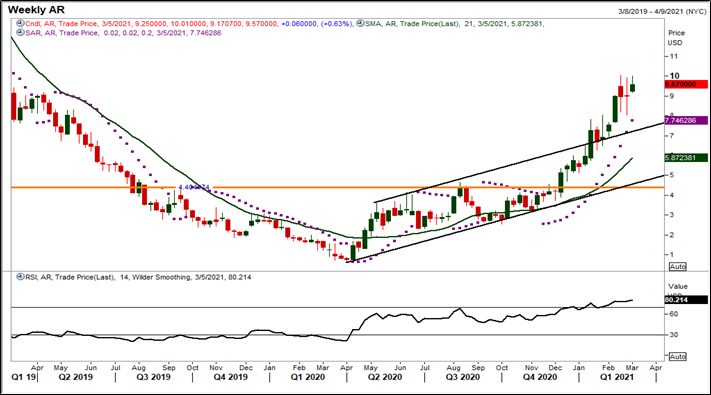
Antero Resources Corporation Weekly Technical Chart
Source: EODHD/Others, Thomson Reuters; Analysis: Kalkine Group
Antero Resources Corporation (NYSE:AR) prices have been continuously in the bull move from the low of USD 2.55 made on 02 October 2020 to a recent 52-week high of USD 10.04 on 16 February 2021. The stock has been on a strong uptrend for the past six months with a rise of ~294 percent. On the weekly chart, the stock price has broken out of its horizontal trend line (orange line in the above chart) at USD 4.40 level.
The stock is trending upward, forming a series of higher tops and higher bottoms which indicate bulls are still in action. The price has broken out its upward channel pattern at USD 6.68 level on the weekly chart, and thereafter it made a new 52-week high. Currently, the prices are sustaining above the upper band of the rising channel pattern. The major support level for the stock is at the USD 7.21 level.
The momentum oscillator RSI (14-period) is trading in the overbought zone at ~80 levels, indicating that a correction from here may drift the price lower towards the support zone. The major resistance level for the stock is at USD 10.04 and any sustainable move above this level might attract more bullish sentiments for the prices. In addition, the stock price is trading above its 21-period (SMA), acting as a crucial support zone near the pattern. The stock price is trading above its Parabolic SAR indicator, acting as a crucial support zone.
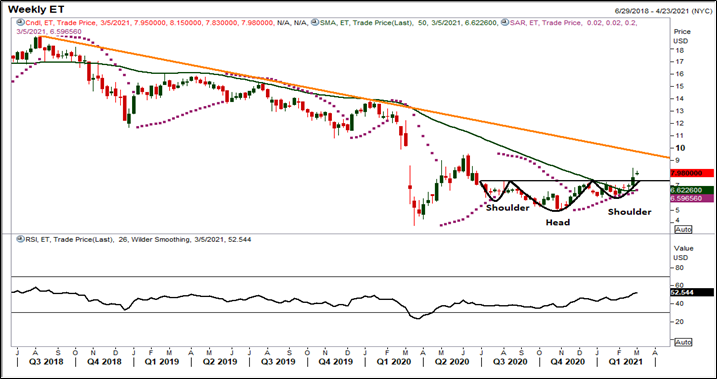
Energy Transfer LP Weekly Technical Chart
Source: EODHD/Others, Thomson Reuters; Analysis: Kalkine Group
Energy Transfer LP (NYSE:ET) has broken an inverse Head & Shoulders (bullish reversal) pattern at USD 7.36 level on the weekly chart, and after that the price touched the 9-month high of USD 8.39 on 25 February 2021. Since January 2021, the stock has witnessed an uninterrupted rally of almost 34 percent and is trading at a 9-month high. After consolidating in the range of USD 6.10 –7.36 for more than 3 months, the price registered a decisive breakout that suggests a change in trend from sideways to bullish.
If the stock price sustains above the neckline breakout level of USD 7.36 then bulls might dominant and are expected to remain active till the next resistance level of USD 9.35, near the downward sloping trend line. Besides, the stock price is trading above its 21-period (SMA), acting as a crucial support zone at the lower end of the pattern. The stock is well placed above its Parabolic SAR, supporting the uptrend. The momentum oscillator RSI (14-period) is trading at ~62 levels.
Conclusion:
Based on the above chart analysis and technical outlook, the natural gas price seems to be in an uptrend. Currently, the natural gas prices are holding the key support zone. The AR & ET chart patterns are poised interestingly. It is to be seen if the prices remain above the support zone or break the crucial resistance zone in the coming weeks.
