


_07_03_2026_03_50_21_133108.jpg)

Highlights
- Telstra is an Australian telecom giant with a market cap of AU$45.58 billion.
- The YTD return of TLS shares is a negative 5.26%, while the ASX 200 has fallen 6.13% in the same period.
- The recent fall in TLS shares has bumped up Telstra’s dividend yield to 4.12%.
Telstra Corporation limited (ASX:TLS) is one of the biggest companies on the Australian bourse, having a market capitalisation of AU$45.58 billion. The company provides a wide range of telecommunication services, ranging from retail mobile to broadband services.
Being a large cap company, Telstra is expected to provide some relief to investors during the times of decent market corrections. However, the year 2022 has kicked off on an almost equally rough note for Telstra.
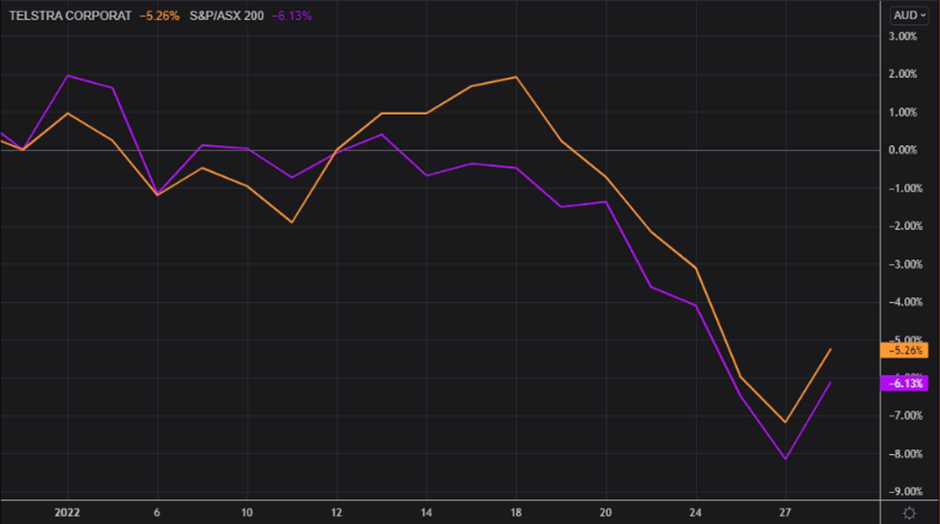
Image Source: EODHD/Others
TLS shares have fallen 5.26% this year to the last closing price of AU$3.96, on 28 January 2022. Compared to the broader market index, the ASX 200, which has delivered a negative year-to-date return of 6.13%, TLS shares have outperformed a bit by delivering lesser drawdowns.
So, what is the TLS chart telling?
TLS shares have been enjoying a strong rally since the beginning of November 2020, when the shares were trading at around AU$2.86 (closing price, as of 30 October 2020). The rally continued all the way to making a multi-year high of AU$4.31 on 18 January 2022, delivering a 50.6% gain during this period, not a bad run for a blue-chip company!
However, the tide started to turn after the stock topped out at a high of AU$4.31. Geo-political tensions, US Fed’s hawkish stance on interest rates and the COVID-19 pandemic jitters all contributed to spook global investors, and Aussie investors were not immune to these factors.
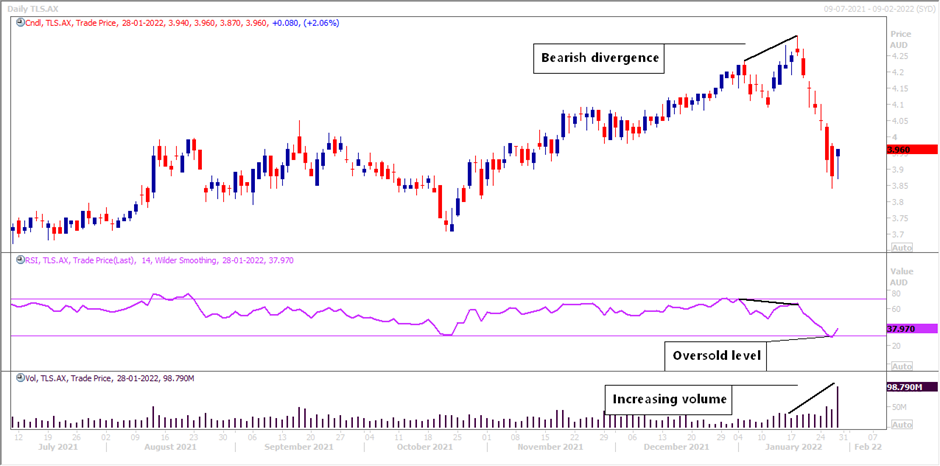
Image Source: EODHD/Others
The stock has fallen sharply from the 52-week high as investors flee towards buying safer assets. The stock dropped 10.9% from its 52-week high to hit the lowest level of AU$3.84 marked in January 2022 so far, essentially eroding all of 2021 gains.
The decline had been so sharp that the 14-day RSI (Relative Strength Index) tumbled to a reading of 28.63 (on 27 January 2022), which denotes an excessively oversold condition for the stock. To put things in perspective, it was the first time that the RSI had fallen below 30, ever since the rally began in November 2020.
What’s next?
The stock has fallen on increasing volume which shows increased participation from investors. Another reason for bears to cheer is that the stock has also formed a bearish divergence at the 52-week high, which is a sign of caution and probable indication of a trend reversal.
On the positive side, precisely from the oversold zone, the stock witnessed sharp buying on 28 January 2022 as value seekers are trying to capitalise on the dip. Also, the fall has bumped up the dividend yield of this blue-chip stock to 4.12% which is enough to lure dividend lovers. Although, sufficient buying has been seen from the bottom levels on 28 January 2022, as indicated by trading volumes (which was the highest in over a year at over 98.7 million shares), the bearish divergence at the top cannot be ignored.
Read More: From BHP to Woodside: How have top 50 stocks on ASX performed so far in 2022?
