A quick snapshot of ASX healthcare index

May 17, 2022 01:18 PM AEST | By Aditi Sarkar
 A quick snapshot of ASX healthcare index
Image source: © Blackboard373  | Megapixl.com

Highlights

  • Sectoral indices provide investors with benchmarks to track stocks against their specific sectors.
  • Eight out of eleven official sectors of ASX ended higher on Monday
  • Market sentiment seems to be getting better after the declaration by Shanghai to end its COVID-19 lockdown on 20 May.

An index comprises a set of stocks and helps in keeping track of a particular market or sector. A sectoral index provides investors with a benchmark to track a stock against a specific sector.

There are many companies listed on a stock exchange, out of which indices screen out a few ones based on market capitalisation, sector or any other parameter. Indices are a benchmark and a standard reference for the entire stock market.

This week, the S&P/ASX 200 index made a green start to the week by closing with a gain of 0.25% on Monday. Eight out of eleven sectors closed higher yesterday with industrials being the best performing sector with a rally of 2.42%.

Market sentiment might have received a boost with China’s Shanghai announcing its decision to end COVID-19 lockdown on 20 May.

Related read: ASX 200 storms 1.9% higher in third-biggest daily gain of 2022

How is the ASX Healthcare Index performing?

The benchmark of the Australian healthcare sector, S&P/ASX 200 Health Care, seems to be trading on a lower note this week after making a green closing on Friday. The index closed off Monday with a loss of 0.60%. The index continued its downtrend on Tuesday, trading at a loss of1.24%, at midday.

The S&P/ASX 200 Healthcare provides investors with a sector benchmark for the companies included in the S&P/ASX 200 classified as members of the GICS® healthcare sector and sub-industries. The index was launched on 02 July, 2002, and it uses the float-adjusted market cap weighting method.

The index has a total of 14 constituents. Australia holds 92.2% weightage in the index regarding geographical breakdown, followed by the United States (6.3%) and New Zealand (1.5%).

Let us have a quick glance at trends in returns of the index for the past ten years.

Price return by healthcare index over the past ten years

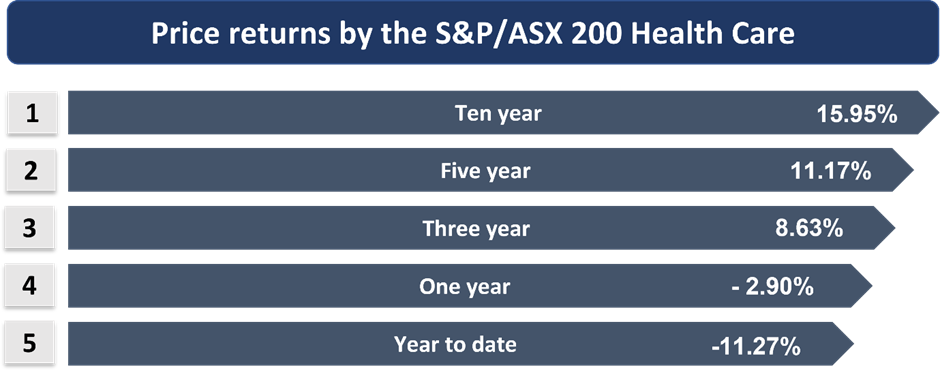
Image source: © 2022 Kalkine Media®

Also read: WES, GMG, WOW, TCL: How these ASX blue-chip stocks performed today?


Disclaimer

The content, including but not limited to any articles, news, quotes, information, data, text, reports, ratings, opinions, images, photos, graphics, graphs, charts, animations and video (Content) is a service of Kalkine Media Pty Ltd (Kalkine Media, we or us), ACN 629 651 672 and is available for personal and non-commercial use only. The principal purpose of the Content is to educate and inform. The Content does not contain or imply any recommendation or opinion intended to influence your financial decisions and must not be relied upon by you as such. Some of the Content on this website may be sponsored/non-sponsored, as applicable, but is NOT a solicitation or recommendation to buy, sell or hold the stocks of the company(s) or engage in any investment activity under discussion. Kalkine Media is neither licensed nor qualified to provide investment advice through this platform. Users should make their own enquiries about any investments and Kalkine Media strongly suggests the users to seek advice from a financial adviser, stockbroker or other professional (including taxation and legal advice), as necessary. Kalkine Media hereby disclaims any and all the liabilities to any user for any direct, indirect, implied, punitive, special, incidental or other consequential damages arising from any use of the Content on this website, which is provided without warranties. The views expressed in the Content by the guests, if any, are their own and do not necessarily represent the views or opinions of Kalkine Media. Some of the images/music that may be used on this website are copyright to their respective owner(s). Kalkine Media does not claim ownership of any of the pictures displayed/music used on this website unless stated otherwise. The images/music that may be used on this website are taken from various sources on the internet, including paid subscriptions or are believed to be in public domain. We have used reasonable efforts to accredit the source wherever it was indicated as or found to be necessary.


AU_advertise

Advertise your brand on Kalkine Media

Sponsored Articles


Investing Ideas

Previous Next
We use cookies to ensure that we give you the best experience on our website. If you continue to use this site we will assume that you are happy with it.