


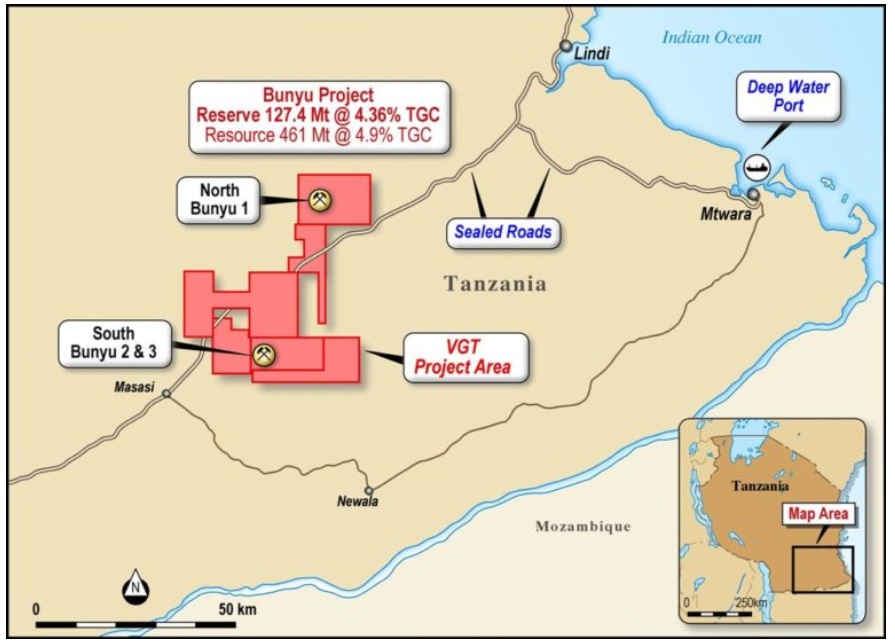
Volt Resources Limited (ASX:VRC), based in Perth, Australia, is a graphite exploration company currently expediting development of its 100%-owned flagship property, the Bunyu Graphite Project, also known as the largest graphite mineral resource in Tanzania, with critical infrastructure in place. Simultaneously, the company keeps exploring for and evaluating additional prospective graphite deposits around the world, to enhance value for its shareholders.
Source: Companyâs Website
The Pre-Feasibility Study (PFS) for Bunyu Project was completed in December 2016 suggesting two staged development, confirming robust technical and financial viability with a Mineral Resource Estimate (JORC 2012 compliant) of 461Mt @ 4.9% TGC, followed by the completion of the Feasibility Study (FS) for Stage 1 in July 2018.
The FS also presented a compelling economic and financial case and the company embarked on an exciting journey to become one of the top three global producers of natural flake graphite, backed by an outstanding leadership team.
Read here in detail - Volt Resources Envisages Natural Graphite Supply Leader Position Through Bunyu Project by 2020
The Stage 1 of the Bunyu Project would essentially focus on establishing the infrastructure and a strong market presence, with the production scheduled to begin by Q3 2020 and first cash-flows expected from H2 2020, that would pave way for the significantly larger Stage 2 expansion project. The company is planning to commence the Definitive Feasibility Study (DFS) for expansion of the project (Stage 2) in late 2019 or early 2020, with commissioning planned for late 2022 depending upon the market appetite for Bunyu graphite products.
With a targeted funding of USD 40 million, Volt Resources is presently advancing funding initiatives for Stage 1, with Exotix Capital as the funding advisor, and reporting consistent headways in this regard. Some of the ongoing initiatives include the Tanzanian Note Issue and Note Issue and Listing on the Stock Exchange of Mauritius.
The company also has various binding and non-binding offtake agreements in place.
More on the Funding activities and Offtake Agreements for the project may be READ here.
The company also recently released its Annual Report FY19 throwing light on a dynamic year.
Market Opportunity
Graphite, one of the most versatile non-metallic minerals in the world, is as strong as diamonds and its unique structure makes it soft, light and highly resistant to heat.
According to Benchmark Mineral Intelligenceâ Report, with the burgeoning electric vehicle (EV) revolution and the inception of the utility storage market, the demand for graphite used as anode material, which has 7-10 times higher graphite requirement than lithium, in lithium ion batteries (LIBs) is forecasted to increase more than 200% in the coming four years.
Moreover, the growing investments into new LIB capacity are estimated to be in excess of $ 12 billion by 2020. Besides, China apparently has hit its peak natural graphite production which presents a huge opportunity for emerging and existing graphite suppliers to capitalise on the same and enjoy the benefits of the sprawling EV boom across the world.
Technical Analysis
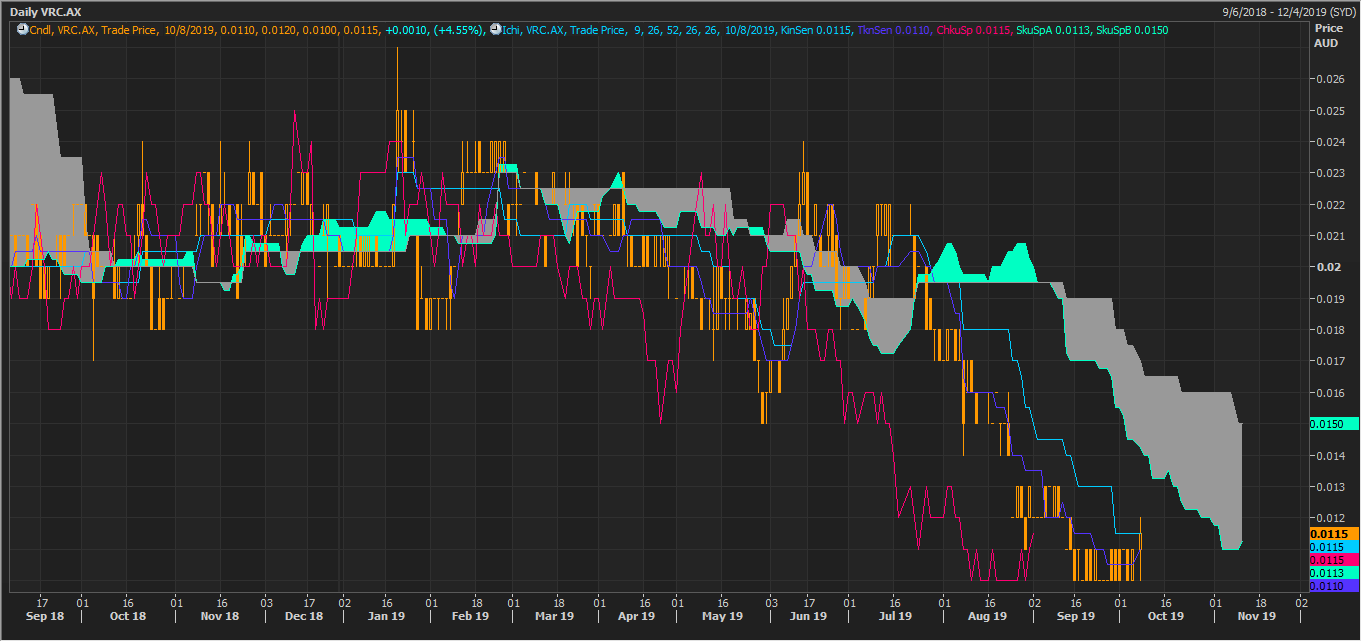
VRC Daily Chart (Source: Thomson Reuters)
On the daily chart, the share prices of the company are trading below the Span A of Ichimoku cloud, which is at $0.0113 and is the mean of the conversion line (dark blue) and the base line (light blue). The Span B of the cloud, which is the mean of 26 day high and low is at $0.0150.
The crossover of conversion line (which is the mean of 9 day high and low) from above the baseline (which is the mean of 26 day high and low) represent negative crossover and the negative crossover has strength as it took place below the Span A.
However, the recent uptick in the stock has turned the direction of the conversion line towards up, and the conversion line gave a close at $0.115. The investors should keep a close eye around the level of $0.115 as a crossover of conversion from below the baseline could instigate early signs of trend reversal.
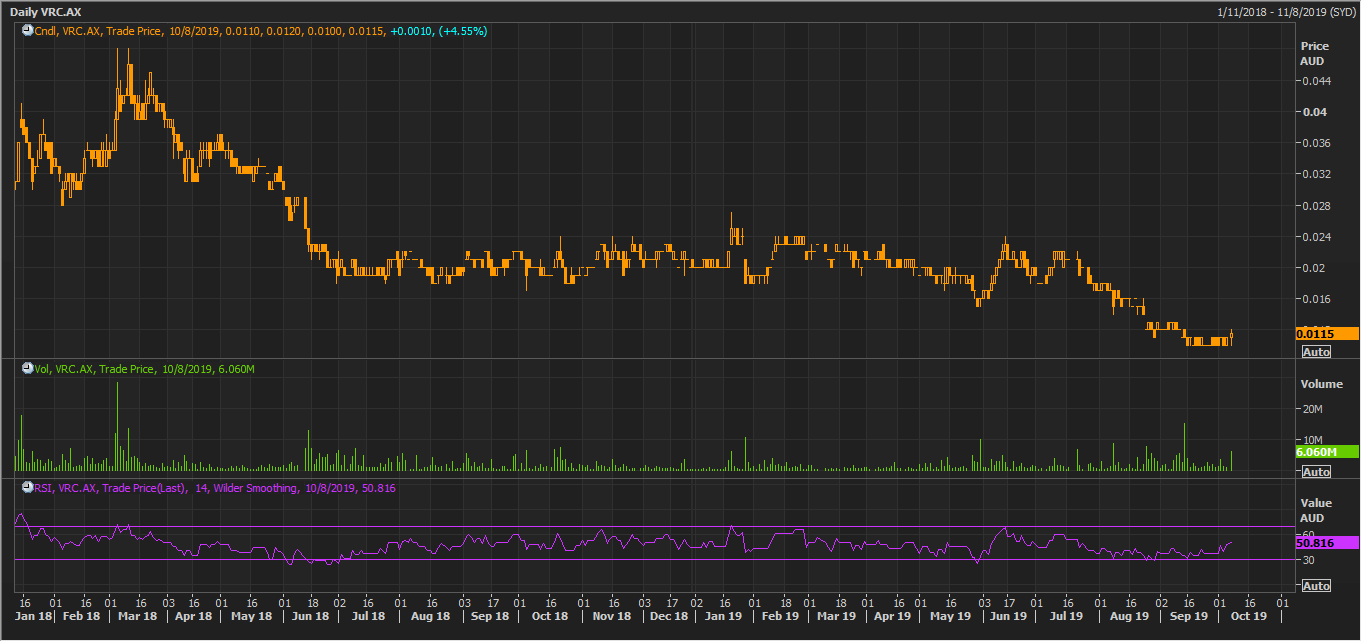
VRC Daily Chart (Source: Thomson Reuters)
The increase in volume coupled with the upside turn in the 14-day Relative Strength Index above the mean value of 50 suggests that the bullâs interest is still intact; moreover, the chart is currently showcasing a bullish divergence, as the RSI is trading flat while the stock price is trending lower. In this scenario a break and close above $0.115 could further instigate bullâs interest.
On 08 October 2019, VRC closed the trade at $0.011, with a market cap of $17.66 million. The stock has appreciated by 10% in the past one week.
Disclaimer
This website is a service of Kalkine Media Pty. Ltd. A.C.N. 629 651 672. The website has been prepared for informational purposes only and is not intended to be used as a complete source of information on any particular company. The above article is sponsored but NOT a solicitation or recommendation to buy, sell or hold the stock of the company (or companies) under discussion. We are neither licensed nor qualified to provide investment advice through this platform.
